. 2013 Sep-Dec;17(3):143-70.
doi: 10.1177/1084713813506301. Epub 2013 Nov 18.

Modern prescription theory and application: realistic expectations for speech recognition with hearing AIDS

Affiliations

Modern prescription theory and application: realistic expectations for speech recognition with hearing AIDS

Earl E Johnson. Trends Amplif. 2013 Sep-Dec.

Abstract

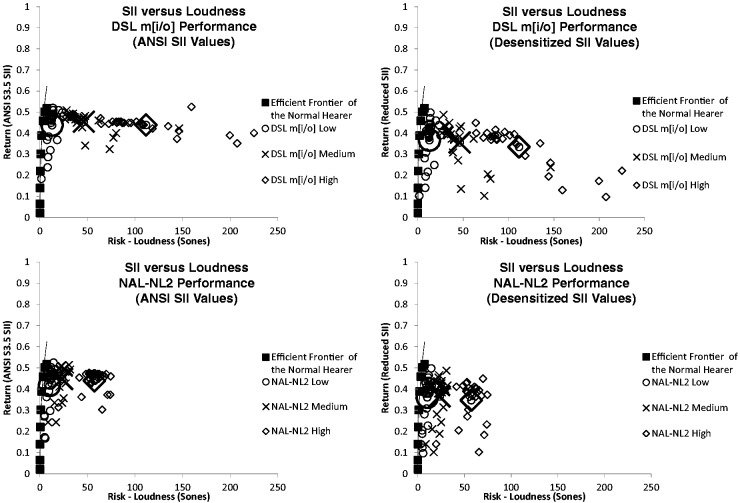
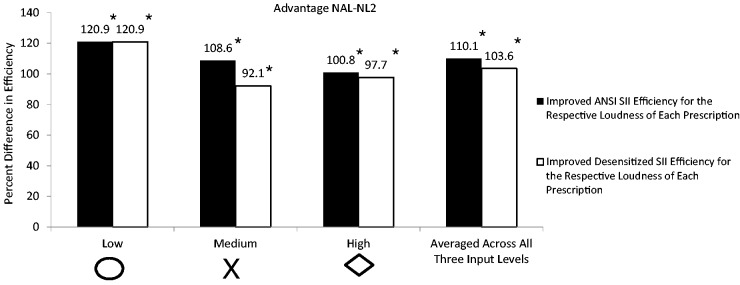
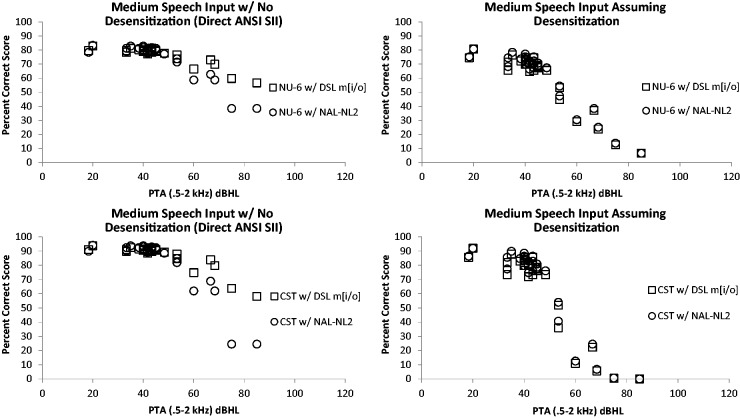
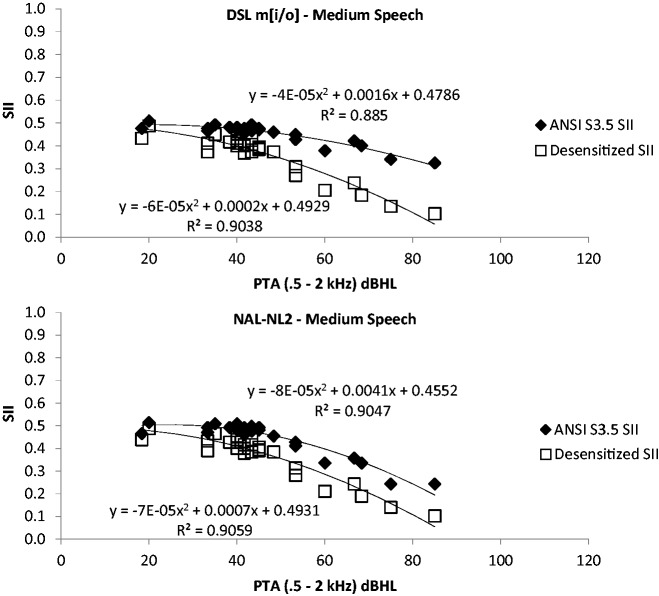
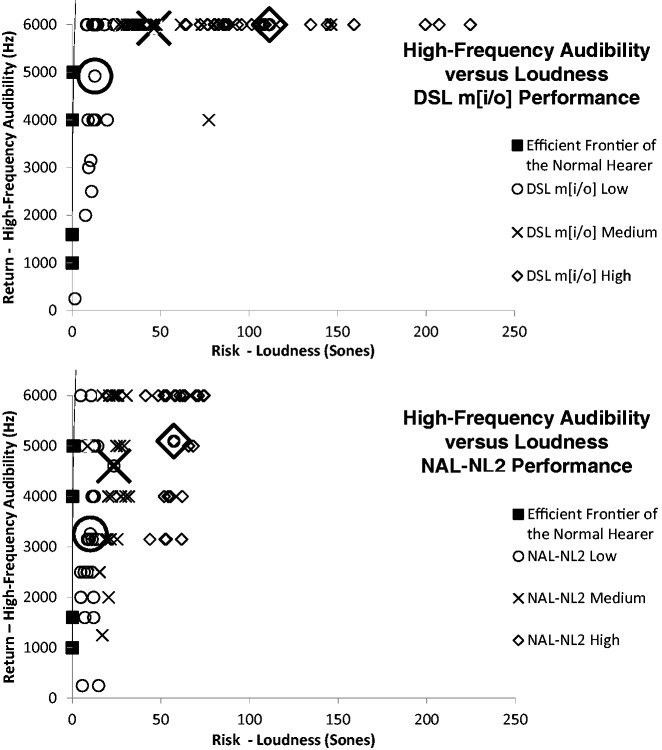
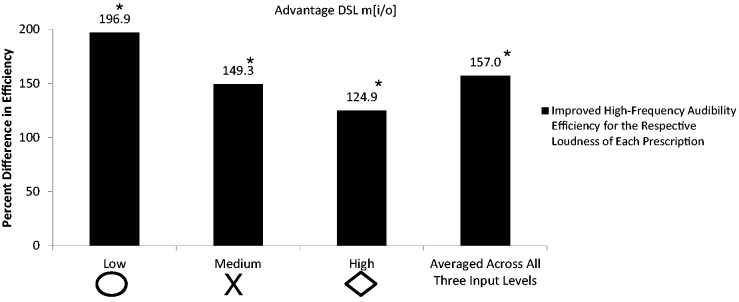
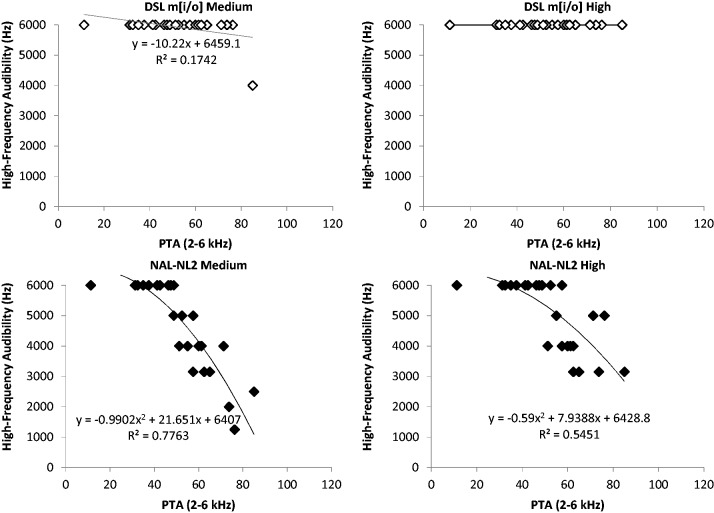
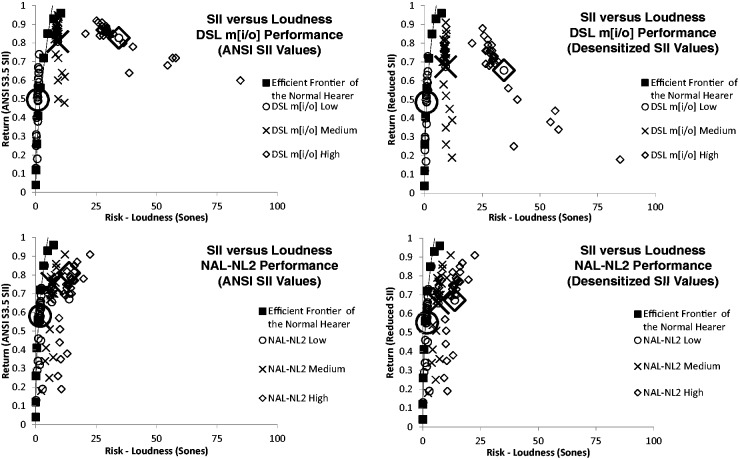
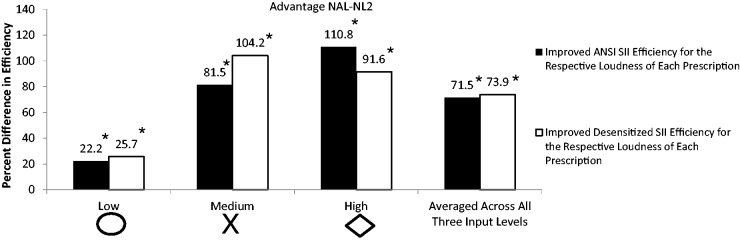
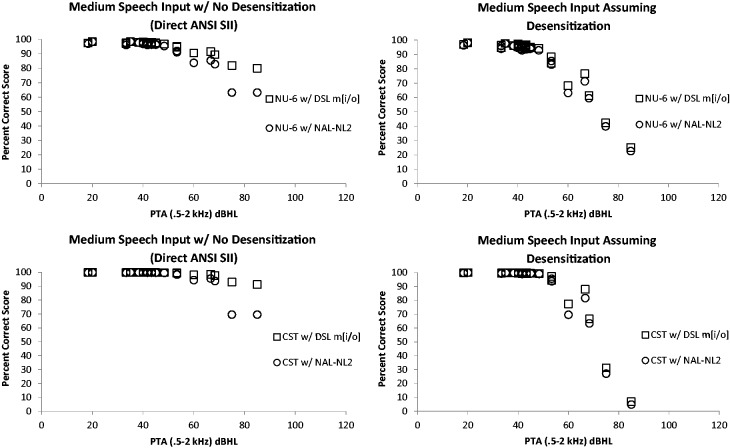
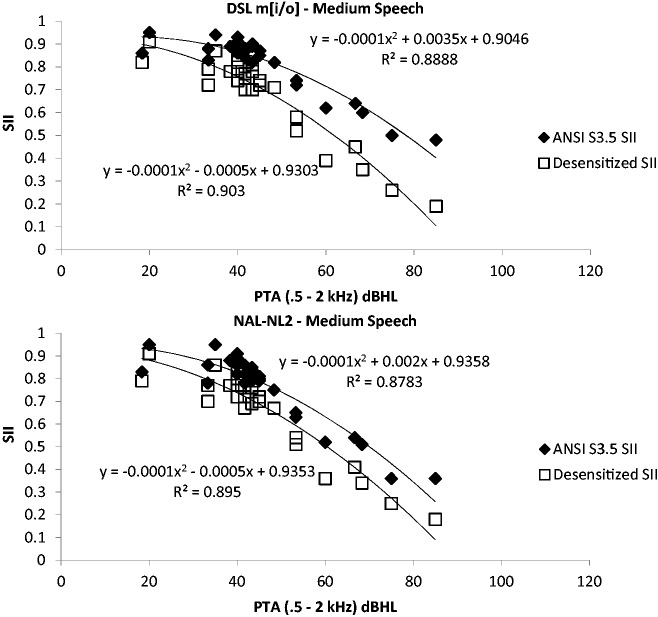
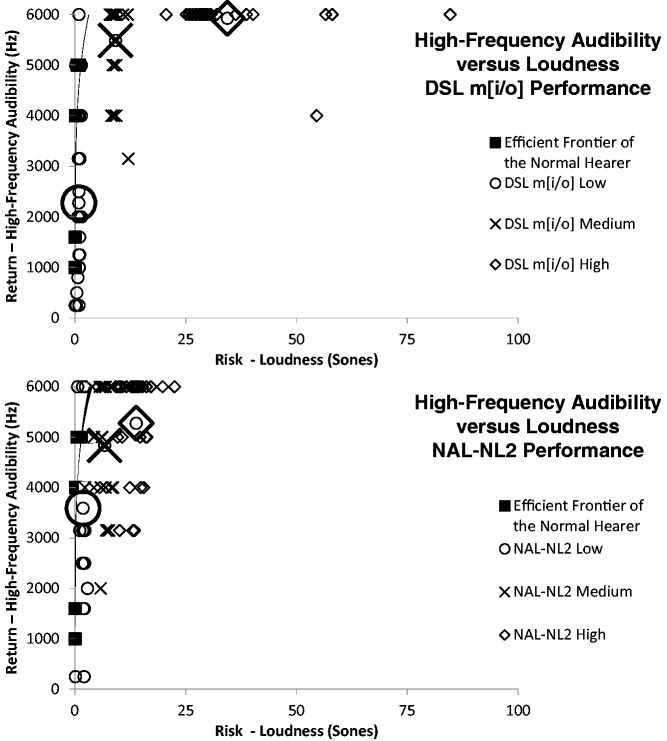
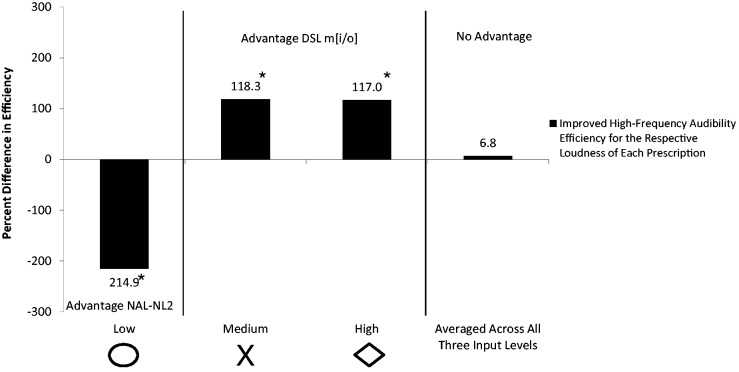
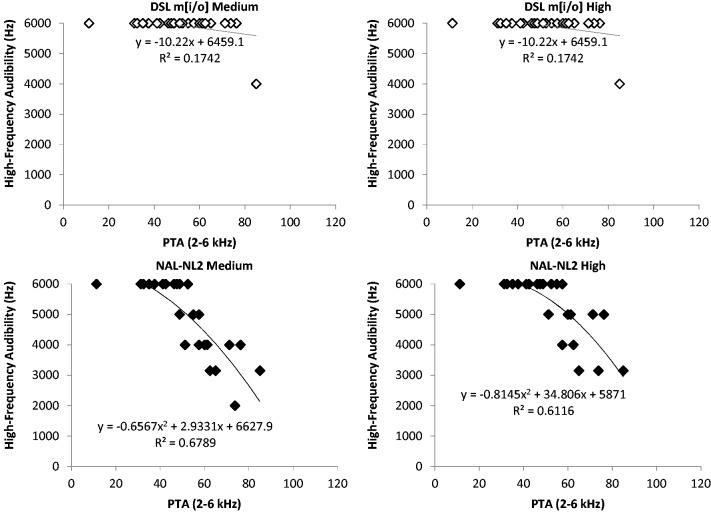
A major decision at the time of hearing aid fitting and dispensing is the amount of amplification to provide listeners (both adult and pediatric populations) for the appropriate compensation of sensorineural hearing impairment across a range of frequencies (e.g., 160-10000 Hz) and input levels (e.g., 50-75 dB sound pressure level). This article describes modern prescription theory for hearing aids within the context of a risk versus return trade-off and efficient frontier analyses. The expected return of amplification recommendations (i.e., generic prescriptions such as National Acoustic Laboratories-Non-Linear 2, NAL-NL2, and Desired Sensation Level Multiple Input/Output, DSL m[i/o]) for the Speech Intelligibility Index (SII) and high-frequency audibility were traded against a potential risk (i.e., loudness). The modeled performance of each prescription was compared one with another and with the efficient frontier of normal hearing sensitivity (i.e., a reference point for the most return with the least risk). For the pediatric population, NAL-NL2 was more efficient for SII, while DSL m[i/o] was more efficient for high-frequency audibility. For the adult population, NAL-NL2 was more efficient for SII, while the two prescriptions were similar with regard to high-frequency audibility. In terms of absolute return (i.e., not considering the risk of loudness), however, DSL m[i/o] prescribed more outright high-frequency audibility than NAL-NL2 for either aged population, particularly, as hearing loss increased. Given the principles and demonstrated accuracy of desensitization (reduced utility of audibility with increasing hearing loss) observed at the group level, additional high-frequency audibility beyond that of NAL-NL2 is not expected to make further contributions to speech intelligibility (recognition) for the average listener.

Keywords: efficiency; hearing aids; modern prescription theory; realistic expectations; speech recognition.


Figures

Figure 1.
Figure 1.
The mean hearing sensitivity thresholds for the left and right ears of 27 audiograms (left panel). Note. The mean thresholds of the 27 audiograms compared with the audiograms in Ching et al. (in press). The same 27 audiograms were used during the generation of both the pediatric and adult prescriptions.
Figure 2.
Figure 2.
A SpeechMap plot on the Audioscan Verifit of hearing sensitivity thresholds in decibels SPL and the accompanying NAL-NL2 (left panel) and DSL m[i/o] (right panel) real-ear aided response prescriptive targets which demonstrates audibility of frequencies. Note. The vertical arrow points to the frequency at which root mean square audibility in the high frequencies is no longer present.
Figure 3.
Figure 3.
Scatterplot of SII versus loudness when compared with the efficient frontier of the normal hearer for the pediatric population fit with DSL m[i/o] (top panels) or NAL-NL2 (bottom panels). Note. Low, medium, and high refer to the input level of speech. The large symbols are the average of all the low-, medium-, and high-input-level data in accordance to the corresponding symbol shape.
Figure 4.
Figure 4.
The improved efficiency for children fit with NAL-NL2 when compared with DSL m[i/o] in a return versus risk (SII vs. loudness) analysis. Note. The asterisk refers to a statistically significant difference between the two prescriptions in efficiency.
Figure 5.
Figure 5.
A scatter plot of percent correct scores with (right column) and without (left column) desensitization as a function of PTA for children fit with DSL m[i/o] (squares) or NAL-NL2 (circles) on both the NU-6 (top row) and CST (bottom row) speech material.
Figure 6.
Figure 6.
The reduction of SII for children as hearing loss increases. Note. The ANSI SII values (black triangles) and desensitized SII values (white squares) are shown for DSL m[i/o] (top panel) and NAL-NL2 (bottom panel).
Figure 7.
Figure 7.
Scatterplot of high-frequency audibility versus loudness when compared with the efficient frontier of the normal hearer for children fit with DSL m[i/o] (top panel) or NAL-NL2 (bottom panel). Note. Low, medium, and high refer to the input level of speech. The large symbols are the average of all the low-, medium-, and high-input-level data in accordance to the corresponding symbol shape.
Figure 8.
Figure 8.
The improved efficiency for children fit with DSL m[i/o] when compared with NAL-NL2 in a return versus risk (high-frequency audibility vs. loudness) analysis. Note. The asterisk refers to a statistically significant difference between the two prescriptions in efficiency.
Figure 9.
Figure 9.
The amount of high-frequency audibility as a function of PTA for children fit with either the DSL m[i/o] (top panels) or NAL-NL2 (bottom panels) at medium-(left column) and high-(right column) input levels.
Figure 10.
Figure 10.
Scatter plot of SII versus loudness when compared with the efficient frontier of the normal hearer for adults fit with DSL m[i/o] (top panels) or NAL-NL2 (bottom panels). Note. Low, medium, and high refer to the input level of speech. The large symbols are the average of all the low-, medium-, and high-input-level data in accordance to the corresponding symbol shape.
Figure 11.
Figure 11.
The improved efficiency for adults fit with NAL-NL2 when compared with DSL m[i/o] in a return versus risk (SII vs. loudness) analysis. Note. The asterisk refers to a statistically significant difference between the two prescriptions in efficiency.
Figure 12.
Figure 12.
Scatterplot of percent correct scores with (right column) and without (left column) desensitization as a function of PTA for adults fit with DSL m[i/o] (squares) or NAL-NL2 (circles) on both the NU-6 (top row) and CST (bottom row) speech material.
Figure 13.
Figure 13.
The reduction of SII for adults as hearing loss increases. Note. The ANSI SII values (black triangles) and desensitized SII values (white squares) are shown for DSL m[i/o] (top panel) and NAL-NL2 (bottom panel).
Figure 14.
Figure 14.
Scatterplot of high-frequency audibility versus loudness when compared with the efficient frontier of the normal hearer for adults fit with DSL m[i/o] (top panel) or NAL-NL2 (bottom panel). Note. Low, medium, and high refer to the input level of speech. The large symbols are the average of either all the low-, medium-, and high-input-level data in accordance to the corresponding symbol shape.
Figure 15.
Figure 15.
The improved efficiency for adults fit with DSL m[i/o] when compared with NAL-NL2 in a return versus risk (high-frequency audibility vs. loudness) analysis. Note. The asterisk refers to a statistically significant difference between the two prescriptions in efficiency.
Figure 16.
Figure 16.
The amount of high-frequency audibility as a function of PTA for adults fit with either the DSL m[i/o] (top panels) or NAL-NL2 (bottom panels) at medium (left column) and high (right column) input levels.

Similar articles

Cited by

References

    1. Abrams H. B., Chisolm T. H., McManus M., McArdle R. (2012) Initial-fit approach versus verified prescription: Comparing self-perceived hearing aid benefit. Journal of the American Academy of Audiology 23: 768–778 - PubMed
    1. American National Standards Institute (2007) ANSI S3.5-1997 – Methods for calculation of the speech intelligibility index, New York, NY: Author
    1. Audioscan. (2012). Verifit®User’s Guide (Version 3.10). Retrieved from http://audioscan.com/Docs/vfmanual.pdf.
    1. Bentler R., Pavlovic C. V. (1992) Addendum to “Transfer functions and correction factors used in hearing aid evaluation and research.”. Ear and Hearing 1992: 284–286 - PubMed
    1. Bernstein J., Summers V., Grassi E., Grant K. (2013) Auditory models of suprathreshold distortion and speech intelligibility in persons with impaired hearing. Journal of the Academy of Audiology 24: 307–328 - PubMed

Publication types