. 2013:4:2784.
doi: 10.1038/ncomms3784.

Analogue encoding of physicochemical properties of proteins in their cognate messenger RNAs

Affiliations
Free PMC article

Analogue encoding of physicochemical properties of proteins in their cognate messenger RNAs

Anton A Polyansky et al. Nat Commun. 2013.
Free PMC article

Abstract

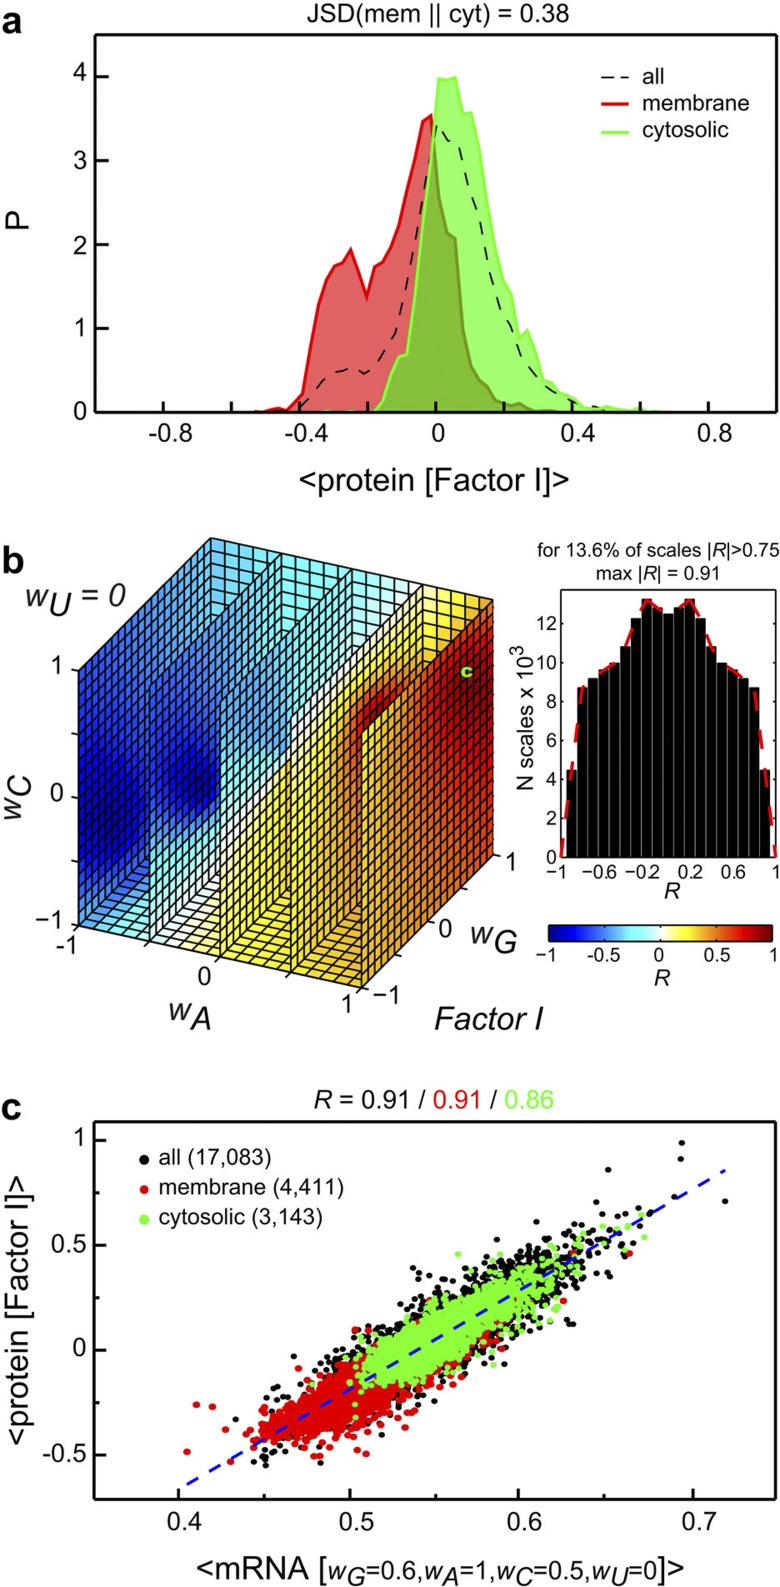
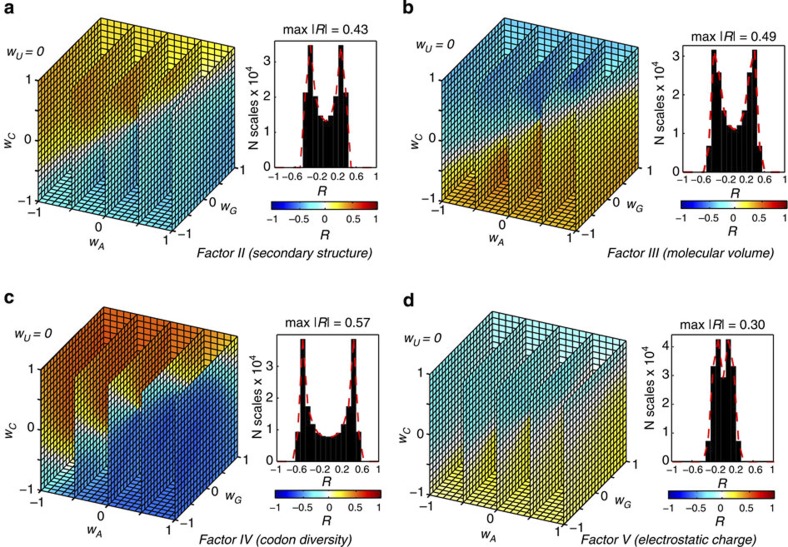
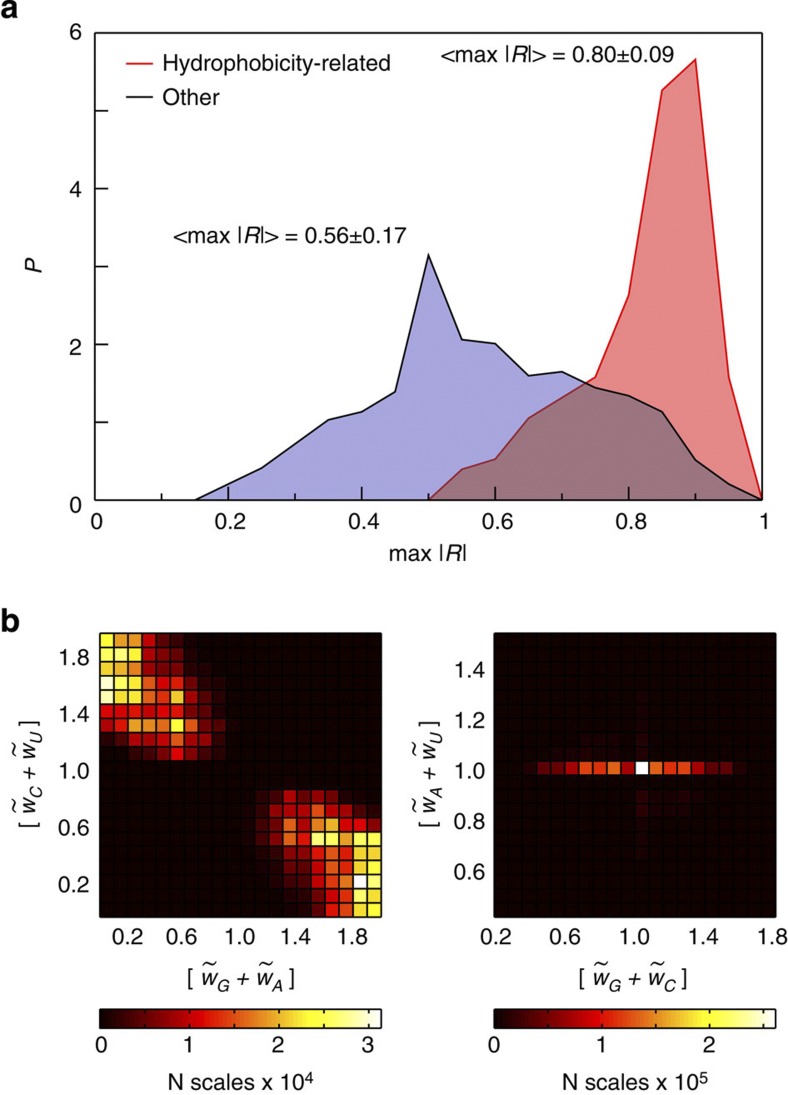
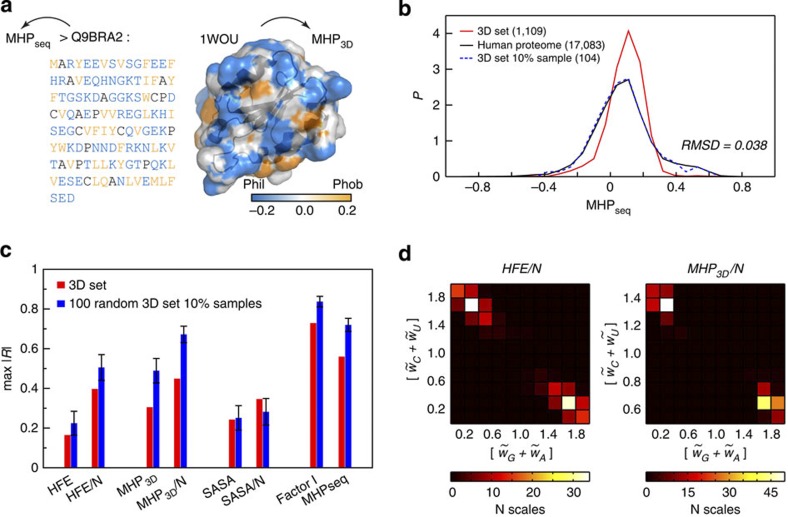
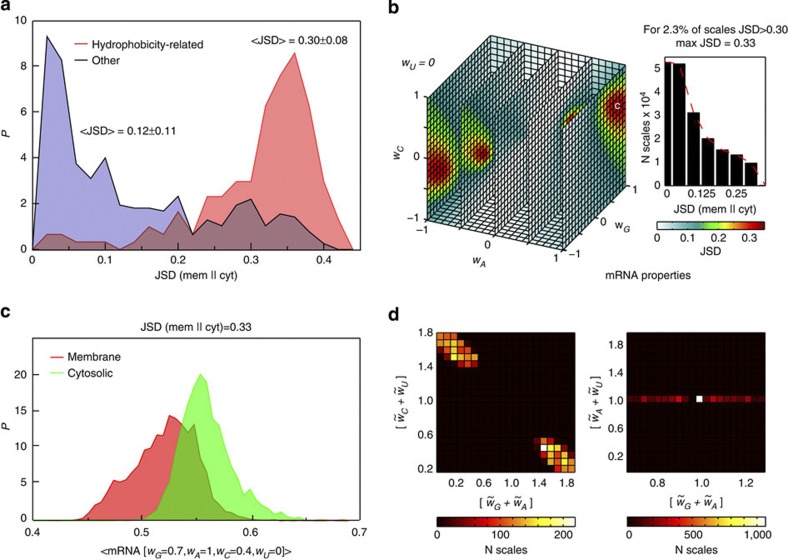
Being related by the genetic code, mRNAs and their cognate proteins exhibit mutually interdependent compositions, which implies the possibility of a direct connection between their general physicochemical properties. Here we probe the general potential of the cell to encode information about proteins in the average characteristics of their cognate mRNAs and decode it in a ribosome-independent manner. We show that average protein hydrophobicity, calculated from either sequences or 3D structures, can be encoded in an analogue fashion by many different average mRNA sequence properties with the only constraint being that pyrimidine and purine bases be clearly distinguishable on average. Moreover, average characteristics of mRNA sequences enable discrimination between cytosolic and membrane proteins even in the absence of topogenic signal-based mechanisms. Our results suggest that protein and mRNA localization may be partly determined by basic physicochemical rationales and interdependencies between the two biomolecules.


Figures

Figure 1
Figure 1. Encoding of average sequence hydrophobicity of proteins in average properties of their cognate mRNA coding sequences.
(a) Distribution of average protein sequence hydrophobicity as calculated according to the Factor I scale for the entire human proteome (dashed curve), annotated membrane proteins (red filled curve) and annotated cytosolic proteins (green filled curve). (b) Distribution of Pearson correlation coefficients R (wG, wA, wC, wU) obtained for the human proteome using the Factor I scale (see Methods) and shown as a 3D projection with a fixed value of wU=0 (left) or as a 1D histogram (right). The cube is coloured according to the R values as given in the colour legend. The nucleotide scale used for the scatter plot in panel c is indicated with ‘c’. (c) Scatter plot of average sequence hydrophobicity of human proteins and generalized average mRNA sequence properties calculated using a nucleotide scale that provides the highest value of |R|. Annotated membrane and cytosolic proteins are depicted in red and green, respectively, while all other proteins are in black.
Figure 2
Figure 2. Hydrophobicity-independent average protein sequence properties display a weak connection to cognate mRNA sequences.
Distributions of Pearson correlation coefficients R (wG, wA, wC, wU) obtained for the human proteome using (a) Factor II (secondary structure), (b) Factor III (molecular volume), (c) Factor IV (codon diversity) and (d) Factor V (electrostatic charge) scales, and shown as a 3D projection with a fixed value of wU=0 (left) or as a 1D histogram (right). Cubes are coloured according to the R values as given in the colour legend.
Figure 3
Figure 3. Large-scale analysis of the mRNA encoding potential.
(a) Distributions of maximum attainable values of |R| for 152 hydrophobicity-related (red) and 388 other (blue) amino-acid scales over all generalized nucleotide scales tested for the human proteome. (b) For all nucleotide scales that give |R|>0.75 for any of 152 hydrophobicity-related scales, we combine the weights for different pairs as indicated after rescaling them between 0 and 1. The heat maps are coloured according to the colour legends given below.
Figure 4
Figure 4. Encoding of protein 3D structure hydrophobicity in generalized characteristics of cognate mRNA sequences.
(a) Application of MHP approach to the sequence and the 3D structure of a protein. A protein of a representative size from the 3D set human thioredoxin-related protein 14, PDB code: 1WOU, (120 amino acids) is selected as an example and shown in SAS representation. SAS is coloured according to the MHP scale given below. (b) Distributions of average sequence hydrophobicities (calculated using an MHP-derived amino-acid scale) for the entire human proteome (black curve), the 3D set (red curve) and a randomly selected sample subset (dashed blue curve). (c) Maximum values of |R| (max |R| and <max |R|> with error bars signifying standard deviations) for different properties of 3D structures and sequences obtained as a result of regular screening of nucleotide scales for the 3D set and 100 random sample subsets (N is the number of protein residues). (d) 2D histograms of all rescaled nucleotide scales, which provide the maximum values of |R| for MHP3D and HFE of proteins from 100 random subsets, shown as sums of weights for PUR and PYR nucleotides. The heat maps are coloured according to the colour legends given below.
Figure 5
Figure 5. Discriminating between human membrane and cytosolic proteins.
(a) Distributions of the JSD values obtained from the comparisons of distributions of average sequence properties of human membrane and cytosolic proteins for 152 hydrophobicity-related (red) and 388 other (blue) amino-acid scales. (b) JSD (wG, wA, wC, wU) distribution obtained from the comparison of human membrane and cytosolic proteins and shown as a projection onto a cube with fixed wU value of 0 (left) and as a 1D histogram (right). The cube is coloured according to the colour legend given below. Position of the nucleotide scale used for distributions in panel c is indicated with ‘c’. (c) Distribution of generalized average mRNA sequence properties calculated for the annotated human membrane (red) and cytosolic (green) proteins using a nucleotide scale that provides the highest value of JSD. (d) 2D histograms of all rescaled nucleotide scales that provide JSD>0.30, shown as sums of weights for different combinations of nucleotides. The heat maps are coloured according to the colour legends given below.
Figure 6
Figure 6. Generalized nucleotide scale constraints and real nucleotide property scales.
Real nucleotide scales rescaled between 0 and 1 and overlaid with 2D histograms of summed PUR and PYR weights obtained from calculations of R (wG, wA, wC, wU) for mRNA sequence properties and 152 different hydrophobicity scales that give |R|>0.75. Positions of summed PUR/PYR values for different real scales are shown with blue crosses and reflect various physicochemical properties of nucleotides (see Methods for full annotation): size/SASA (scales 1–3), knowledge-based contact statistics (scales 4–7), knowledge-based preference of unpaired conformation (scales 8–9) and hydrophobicity-related scores (scales 10–25). The heat map is coloured according to the colour legend given below.

References

    1. McLane L. M. & Corbett A. H. Nuclear localization signals and human disease. IUBMB Life 61, 697–706 (2009). - PubMed
    1. Saraogi I. & Shan S. O. Molecular mechanism of co-translational protein targeting by the signal recognition particle. Traffic 12, 535–542 (2011). - PMC - PubMed
    1. Verkman A. S. Solute and macromolecule diffusion in cellular aqueous compartments. Trends Biochem. Sci. 27, 27–33 (2002). - PubMed
    1. Brangwynne C. P., Koenderink G. H., MacKintosh F. C. & Weitz D. A. Intracellular transport by active diffusion. Trends Cell Biol. 19, 423–427 (2009). - PubMed
    1. Ando T. & Skolnick J. Crowding and hydrodynamic interactions likely dominate in vivo macromolecular motion. Proc. Natl Acad. Sci. USA 107, 18457–18462 (2010). - PMC - PubMed

Publication types

LinkOut - more resources