. 2013 Nov 20:3:3272.
doi: 10.1038/srep03272.

Quantum simulation of thermally-driven phase transition and oxygen K-edge x-ray absorption of high-pressure ice

Affiliations

Quantum simulation of thermally-driven phase transition and oxygen K-edge x-ray absorption of high-pressure ice

Dongdong Kang et al. Sci Rep. .

Abstract

The structure and phase transition of high-pressure ice are of long-standing interest and challenge, and there is still a huge gap between theoretical and experimental understanding. The quantum nature of protons such as delocalization, quantum tunneling and zero-point motion is crucial to the comprehension of the properties of high-pressure ice. Here we investigated the temperature-induced phase transition and oxygen K-edge x-ray absorption spectra of ice VII, VIII and X using ab initio path-integral molecular dynamics simulations. The tremendous difference between experiments and the previous theoretical predictions is closed for the phase diagram of ice below 300 K at pressures up to 110 GPa. Proton tunneling assists the proton-ordered ice VIII to transform into proton-disordered ice VII where only thermal activated proton-transfer cannot occur. The oxygen K edge with its shift is sensitive to the order-disorder transition, and therefore can be applied to diagnose the dynamics of ice structures.


Figures

Figure 1
Figure 1. The average proton distribution function as a function of the proton position relative to the bond midpoint and the corresponding oxygen-oxygen separation in classical (left panels) and quantum (right panels) simulations at 34.5 GPa.
The corresponding temperature is 100 K, 200 K and 300 K from top to bottom.
Figure 2
Figure 2. The average proton distribution function as a function of the proton position relative to the bond midpoint and the corresponding oxygen-oxygen separation in classical (left panels) and quantum (right panels) simulations at 61.2 GPa.
The corresponding temperature is 100 K, 200 K and 300 K from top to bottom.
Figure 3
Figure 3
(a) Distributions of the O-H bond lengths at different pressures and temperatures and (b) free energy profiles of the protons along the two nearest neighbouring oxygen atoms obtained from quantum (solid lines) and classical (dashed lines) simulations. The pressure is from 34.5 GPa (left), 61.2 GPa (middle) to 107.9 GPa (right) and the temperature is increased from 100 K (top), 200 K (middle) to 300 K (bottom).
Figure 4
Figure 4. Phase diagram of ice VII, VIII and X below 300 K. The red solid lines are the phase boundary between ice VII, VIII and X obtained from our calculations.
The solid up triangles and down triangles denote the lower and upper bound of the phase boundary between ice VII and VIII, respectively. The solid right triangles and left triangles denote the left and right bound of the phase transition between ice X and the other two phases. The green dashed line and blue dot-dashed line are from theoretical results in Ref. . The experimental data previously reported are presented by black dashed lines and solid squares (Ref. 13), open circles (Ref. 12), open squares and crosses (Ref. 32), a solid circle (Ref. 33) and a solid diamond (Ref. 34).
Figure 5
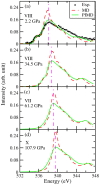
Figure 5. Comparisons of calculated XANES spectra obtained from quantum (solid lines) and classical simulations (dashed lines).
The experiment result for ice VIII at 2.2 GPa is from Ref. . The temperature is 250 K for ice VIII at 2.2 GPa (a) and 100 K for the other three cases. The calculated results in (a) are aligned at the onset and normalized to the same area for comparison with experiment. The results in (b)–(d) are shifted with the same value as (a) for comparisons. The dot-dashed lines denote the peak position of PIMD results. The shift of peak position is 0.6 eV, 1.0 eV and 1.5 eV for (b), (c) and (d) compared with (a).
Figure 6
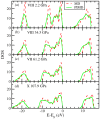
Figure 6. Comparisons of electronic density of states (DOS) calculated from quantum (solid lines) and classical simulations (dashed lines).
The temperature is 250 K for ice VIII at 2.2 GPa (a) and 100 K for the other three cases.

Similar articles

Cited by

References

    1. Huang Y. et al. Size, separation, structural order, and mass density of molecules packing in water and ice. Sci. Rep. 3, 3005; 10.1038/srep03005 (2013). - PMC - PubMed
    1. Huang Y. et al. Hydrogen bond asymmetric local potentials in compressed ice. J. Phys. Chem. B 10.1021/jp407836n (2013). - PubMed
    1. Guillot T. Interiors of giant planets inside and outside the solar system. Science 286, 72–77 (1999). - PubMed
    1. Lissauer J. J. Extrasolar planets. Nature 419, 355–358 (2002). - PubMed
    1. Malenkov G. Liquid water and ices: Understanding the structure and physical properties. J. Phys.: Condens. Matter 21, 283101 (2009). - PubMed

Publication types

LinkOut - more resources