. 2014 Jul;22(7):930-7.
doi: 10.1038/ejhg.2013.265. Epub 2013 Nov 20.

Distribution of ancestral chromosomal segments in admixed genomes and its implications for inferring population history and admixture mapping

Affiliations

Distribution of ancestral chromosomal segments in admixed genomes and its implications for inferring population history and admixture mapping

Wenfei Jin et al. Eur J Hum Genet. 2014 Jul.

Abstract

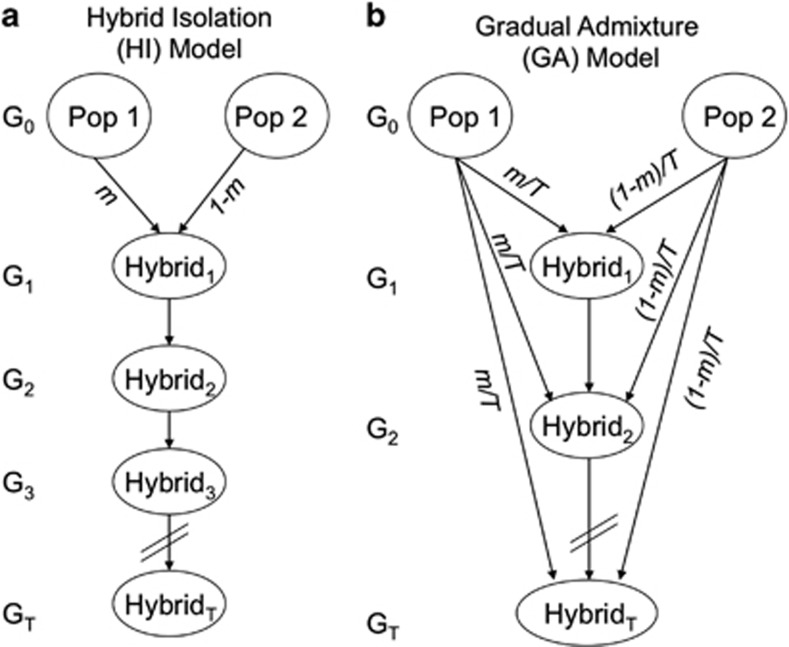
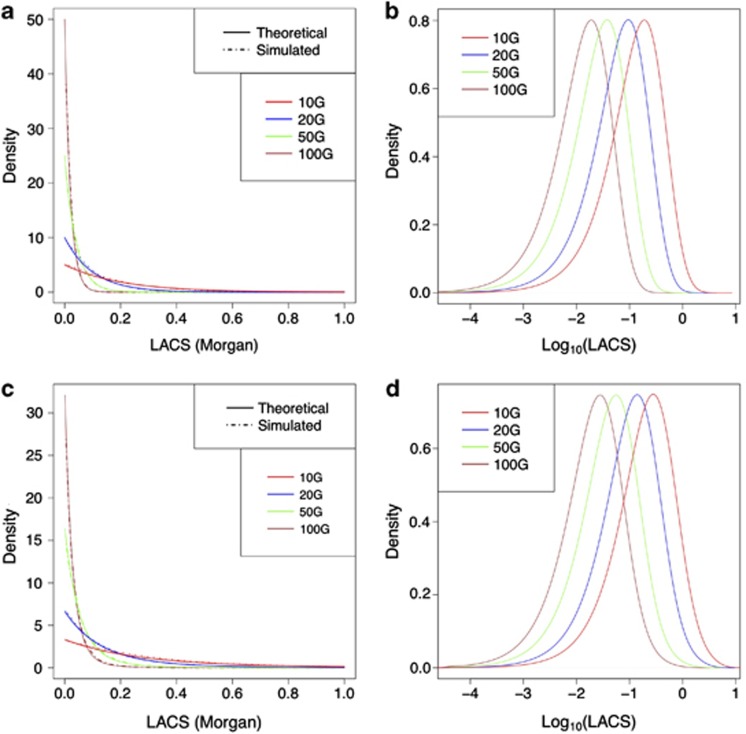
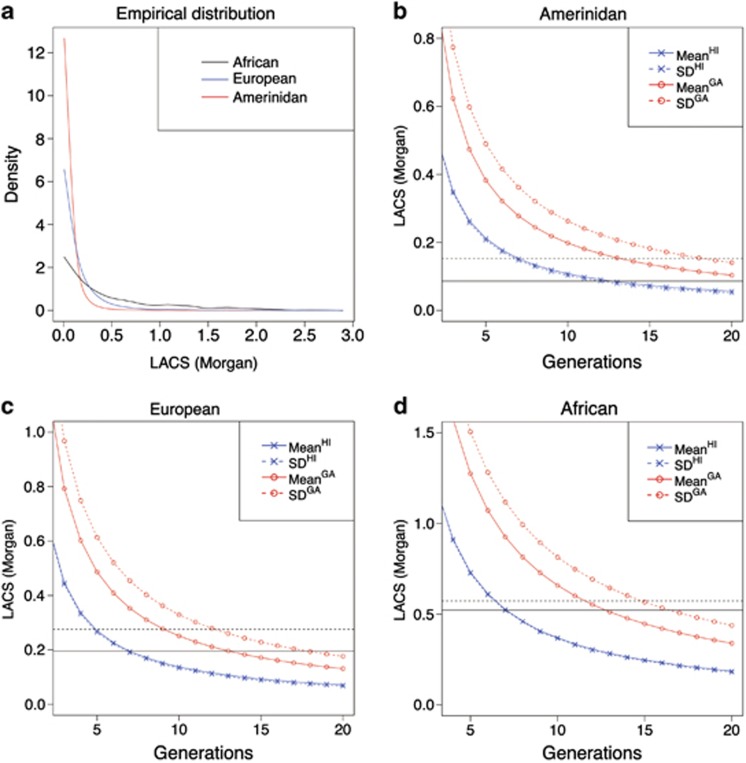
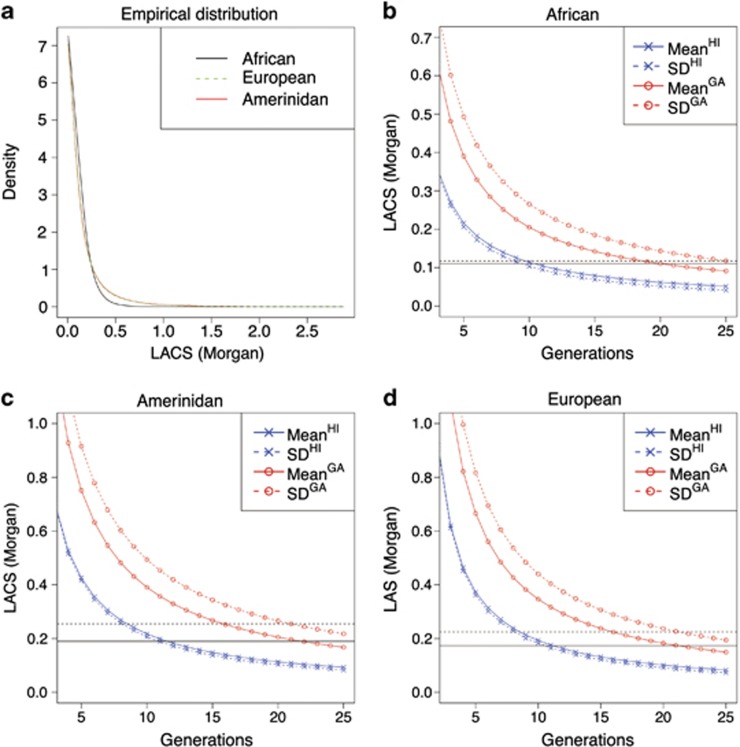
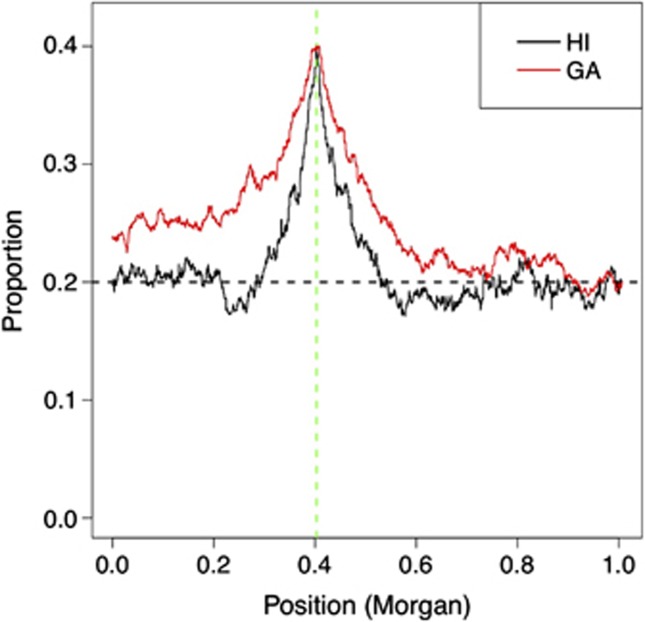
The ancestral chromosomal segments in admixed genomes are of significant importance for both population history inference and admixture mapping, because they essentially provide the basic information for tracking genetic events. However, the distributions of the lengths of ancestral chromosomal segments (LACS) under some admixture models remain poorly understood. Here we introduced a theoretical framework on the distribution of LACS in two representative admixture models, that is, hybrid isolation (HI) model and gradual admixture (GA) model. Although the distribution of LACS in the GA model differs from that in the HI model, we demonstrated that the mean LACS in the HI model is approximately half of that in the GA model if both admixture proportion and admixture time in the two models are identical. We showed that the theoretical framework greatly facilitated the inference and understanding of population admixture history by analyzing African-American and Mexican empirical data. In addition, we found the peak of association signatures in the HI model was much narrower and sharper than that in the GA model, indicating that the identification of putative causal allele in the HI model is more efficient than that in the GA model. Thus admixture mapping with case-only data would be a reasonable and economical choice in the HI model due to the weak background noise. However, according to our previous studies, many populations are likely to be gradually admixed and have pretty high background linkage disequilibrium. Therefore, we suggest using a case-control approach rather than a case-only approach to conduct admixture mapping to retain the statistics power in recently admixed populations.


Figures

Figure 1
Figure 1
Schematic diagram of HI model (a) and GA model (b) for inferring the distribution of LACS. HI and GA models were adopted from previous studies. In each model, the genetic contributions of pop1 and pop2 were m and 1−m, respectively. The admixed population experienced t generations ranging from 1 to T generation.
Figure 2
Figure 2
Distribution of LACS in the HI and GA models. The genetic contribution from parental populations to the admixed population was assumed to be 50%. The number of generations since admixture was assumed to be 10, 20, 50 and 100, respectively. G denotes number of generations since admixture. Solid lines represent theoretical distribution and dashed lines represent simulated distribution. Distribution of LACS in the HI (a) and GA (c) models. Distribution of Log10 (LACS) in the HI (b) and GA (d) models.
Figure 3
Figure 3
Comparison of LACS distributions between HI and GA models. (a) Comparison of mean and SD of LACS between HI and GA models. Error bars and circles represent SD and mean, respectively. (b) Comparison of LACS distribution between HI and GA models when the number of generation is 10 or 20. (c) The change of genetic contribution that transmitted with the given locus along the chromosome in the HI and GA models. (d) The change of genetic contribution transmitted with the given locus along the chromosome in the HI and GA models in a longer chromosome. Green vertical dashed line represents the reference locus.
Figure 4
Figure 4
Admixture history of African-Americans based on three-way admixture. (a) Distributions of LACS for African, European and Amerindian ancestral components in African-American. (b) Mean and SD of LACS for Amerindian ancestral component and theoretical distribution in the HI and GA models. (c) Mean and SD of LACS for European ancestral component and theoretical distribution in the HI and GA models. (d) Mean and SD of LACS for African ancestral component and theoretical distributions in the HI and GA models. Black solid and dashed lines represent the empirical mean and SD of LACS, respectively.
Figure 5
Figure 5
Admixture history of Mexicans based on three-way admixture. (a) Distribution of LACS for African, European and Amerindian ancestral components in Mexican. (b) Mean and SD of LACS for African ancestral component and theoretical distributions in the HI and GA models. (c) Mean and SD of LACS for Amerindian ancestral component and theoretical distributions in the HI and GA models. (d) Mean and SD of LACS for European ancestral component and theoretical distributions in the HI and GA models. Black solid and dashed lines represent the empirical mean and SD of LACS, respectively.
Figure 6
Figure 6
Signatures of association in admixture mapping in the HI and GA models. Vertical dashed green line represents the susceptibility locus. Heretical dashed black line represents the theoretical mean of genetic contribution of the given parental population.

References

    1. Jin W, Wang S, Wang H, Jin L, Xu S. Exploring population admixture dynamics via empirical and simulated genome-wide distribution of ancestral chromosomal segments. Am J Hum Genet. 2012;91:849–862. - PMC - PubMed
    1. Seldin MF, Pasaniuc B, Price AL. New approaches to disease mapping in admixed populations. Nat Rev Genet. 2011;12:523–528. - PMC - PubMed
    1. Verdu P, Rosenberg NA. A general mechanistic model for admixture histories of hybrid populations. Genetics. 2011;189:1413–1426. - PMC - PubMed
    1. Pool JE, Nielsen R. Inference of historical changes in migration rate from the lengths of migrant tracts. Genetics. 2009;181:711–719. - PMC - PubMed
    1. Gravel S. Population genetics models of local ancestry. Genetics. 2012;191:607–619. - PMC - PubMed

Publication types

LinkOut - more resources