. 2014 Jan;164(1):466-80.
doi: 10.1104/pp.113.228221. Epub 2013 Nov 19.

The operation of two decarboxylases, transamination, and partitioning of C4 metabolic processes between mesophyll and bundle sheath cells allows light capture to be balanced for the maize C4 pathway

Affiliations

The operation of two decarboxylases, transamination, and partitioning of C4 metabolic processes between mesophyll and bundle sheath cells allows light capture to be balanced for the maize C4 pathway

Chandra Bellasio et al. Plant Physiol. 2014 Jan.

Abstract

The C4 photosynthesis carbon-concentrating mechanism in maize (Zea mays) has two CO2 delivery pathways to the bundle sheath (BS; via malate or aspartate), and rates of phosphoglyceric acid reduction, starch synthesis, and phosphoenolpyruvate regeneration also vary between BS and mesophyll (M) cells. The theoretical partitioning of ATP supply between M and BS cells was derived for these metabolic activities from simulated profiles of light penetration across a leaf, with a potential 3-fold difference in the fraction of ATP produced in the BS relative to M (from 0.29 to 0.96). A steady-state metabolic model was tested using varying light quality to differentially stimulate M or BS photosystems. CO2 uptake, ATP production rate (JATP; derived with a low oxygen/chlorophyll fluorescence method), and carbon isotope discrimination were measured on plants under a low light intensity, which is considered to affect C4 operating efficiency. The light quality treatments did not change the empirical ATP cost of gross CO2 assimilation (JATP/GA). Using the metabolic model, measured JATP/GA was compared with the predicted ATP demand as metabolic functions were varied between M and BS. Transamination and the two decarboxylase systems (NADP-malic enzyme and phosphoenolpyruvate carboxykinase) were critical for matching ATP and reduced NADP demand in BS and M when light capture was varied under contrasting light qualities.


Figures

Figure 1.
Figure 1.
Metabolic model of C4 assimilation, rates of reaction, and net fluxes between BS and M. The overall scheme reports the reactions of the CCM (Furbank, 2011), Rubisco carboxylation, the reactions of the RPP pathway, the synthesis of starch, respiration, and glyoxylate recycling reactions. The tables, with the corresponding enzyme names, show the actual reaction rates, expressed relative to GA (5.13 μmol m−2 s−1), per unit of substrate transformed. Rates were estimated by parameterizing the model equations (Table II) with data measured under PAR = 125 μE m−2 s−1 (A = 3.96 μmol m−2 s−1; RLIGHT = 1.17 μmol m−2 s−1; JATP = 28.6 μmol m−2 s−1), the output of the C4 model (VC = 5.35 μmol m−2 s−1; VP = 5.89 μmol m−2 s−1; VO = 0.44 μmol m−2 s−1), and the output of the Δ model (Φ = 0.23) under three characteristic ratios of ATP partitionings. These were numbered 1, 2, and 3. Condition 1 corresponds to the lowest ATP available in BS (ATP partitioning similar to that under blue light; Fig. 4B), condition 2 corresponds to an intermediate ATP availability in BS (ATP partitioning equal to that under red light; Fig. 4B), and condition 3 corresponds to the highest ATP available in BS (ATP partitioning equal to that under green light; Fig. 4B). The inset shows net metabolite fluxes between M and BS in multiples of GA. The ATP demand in BS (ATPBS) and M (ATPM), the total NADPH demand (NADPHTOT), and the NADPHBS were also calculated in the same three relevant conditions. PYR, Pyruvic acid.
Figure 2.
Figure 2.
Light penetration in a maize leaf. At left is the modeled maize anatomy. A square BS is surrounded by three portions of M: interveinal M (MI), adaxial M (MAD), and abaxial M (MAB). Epidermis was approximated as a flat reflecting surface. Light penetration was studied through profiles P1 and P2. At right are P1 light profiles (thick lines) and P2 light profiles (thin lines) calculated with the Kubelka-Munk (absorption + scattering) theory and calibrated with spectroscopic data (Table III). Radiation is expressed as the sum of downward + upward photon flux, as a fraction of incident photon flux (dimensionless), and plotted against the depth in the absorbing path of the leaf.
Figure 3.
Figure 3.
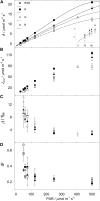
Maize responses to decreasing light intensity under different light qualities. A, Net A. The curves were fitted in order to calculate the light compensation point (Table IV). The inset shows a magnification. B, JATP, measured with the low oxygen-ETR method. C, Online Δ during photosynthesis. D, Φ resolved from Δ. Error bars represent se; n = 4. B, Blue light; G, green light; R, red light.
Figure 4.
Figure 4.
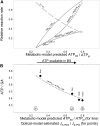
Partitioning of metabolic activities in BS cells and associated shifts in ATP and NADPH demand. A, The output of the metabolic model, shown as a function of increasing theoretical ATPBS/ATPM: the increasing contribution of BS (solid lines) to the total PR (relative to the total), SS (relative to the total), and PEPCK (relative to the highest rate); the predicted NADPH demand in BS (relative to the total [NADPHBS/NADPHTOT]; dotted line); and the predicted T (relative to VP [T/VP]; dashed line). B, The output of the metabolic model is compared with the empirical data. Model output is shown by the dashed line: the predicted (ATPBS + ATPM)/GA is plotted as a function of the predicted ATPBS/ATPM. Empirical data are shown as diamonds: the measured JATP/GA, under blue, red, RGB, and green light (Table I), is plotted against the estimated ATP production partitioning JATPBS/JATPM at 460 nm, 635 nm, white light, and 522 nm (estimated through the optical model; Table III). The lowest ATPBS/ATPM was named condition 1 (left arrow), the partitioning corresponding to red light was named condition 2 (middle arrow), and the highest ATPBS/ATPM was named condition 3 (right arrow).

Similar articles

Cited by

References

    1. Allen WA, Richardson AJ. (1968) Interaction of light with a plant canopy. J Opt Soc Am 58: 1023–1028
    1. Aoyagi K, Nakamoto H. (1985) Pyruvate, Pi dikinase in bundle sheath strands as well as in mesophyll cells in maize leaves. Plant Physiol 78: 661–664 - PMC - PubMed
    1. Baker NR, Long SP (1988) Photosynthesis and temperature, with particular reference to effects on quantum yield. In SP Long, FI Woodward, eds, Plants and Temperature: Society for Experimental Biology Symposium No XXXXII. Company of Biologists, London, pp 347–375 - PubMed
    1. Bellasio C, Griffiths H. (October 8, 2013) Acclimation to low light by C4 maize: implications for bundle sheath leakiness. Plant Cell Environ http://dx.doi.org/10.1111/pce.12194 - PubMed
    1. Berry JA, Farquhar GD (1978) The CO2 concentrating function of C4 photosynthesis: a biochemical model. In D Hall, J Coombs, T Goodwin, eds, Proceedings of the 4th International Congress on Photosynthesis. Biochemical Society, London, pp 119–131

Publication types