. 2013 Dec 7;58(23):8573-91.
doi: 10.1088/0031-9155/58/23/8573.

Breast density quantification with cone-beam CT: a post-mortem study

Breast density quantification with cone-beam CT: a post-mortem study

Travis Johnson et al. Phys Med Biol. .

Abstract

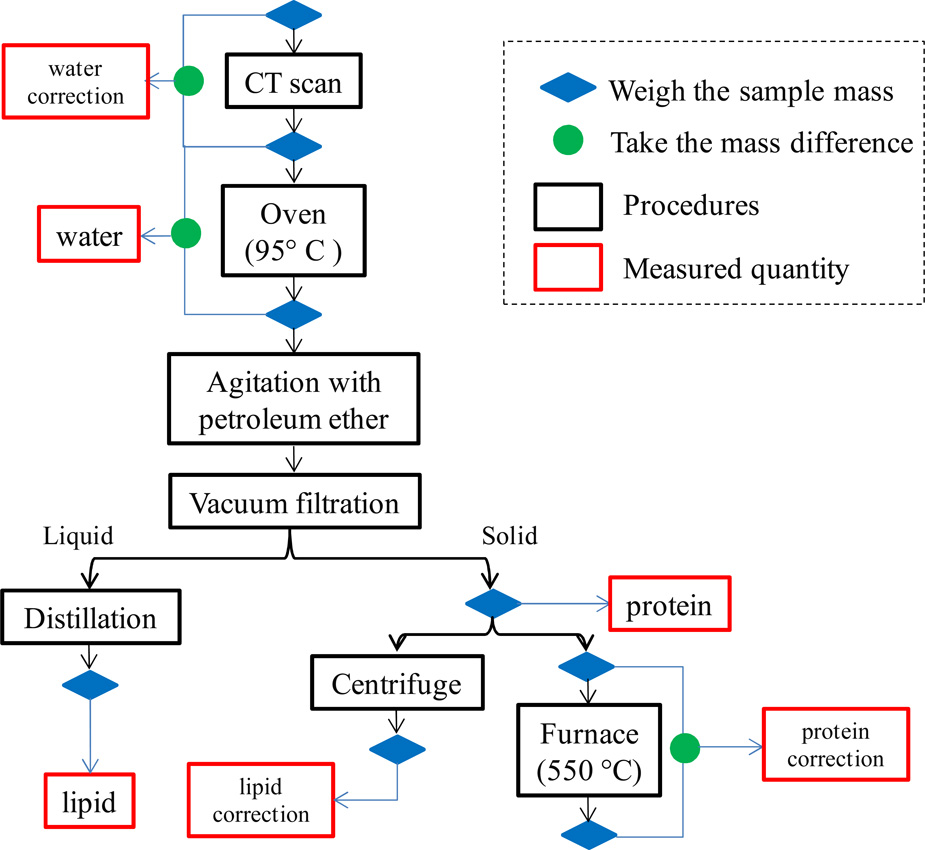
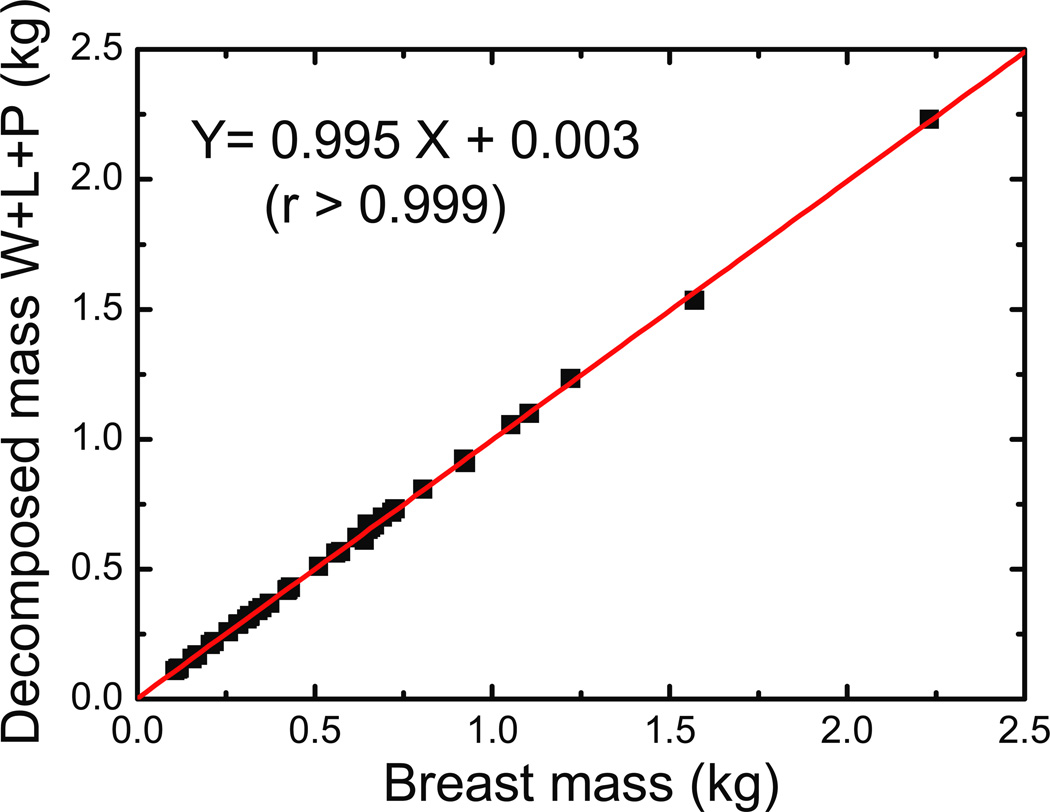
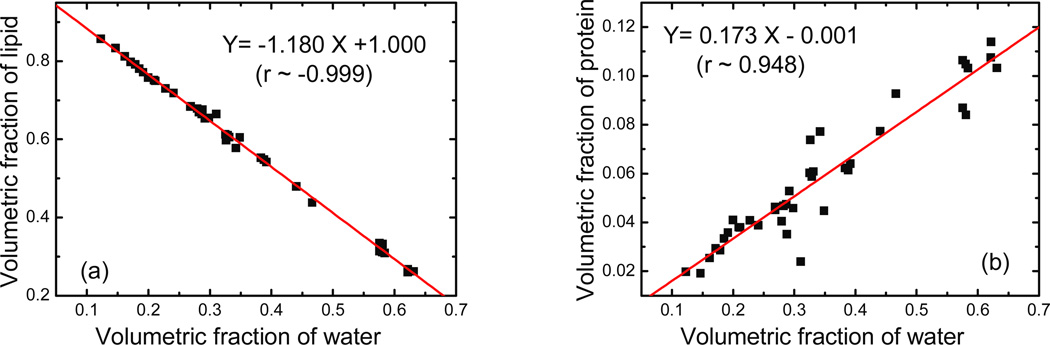
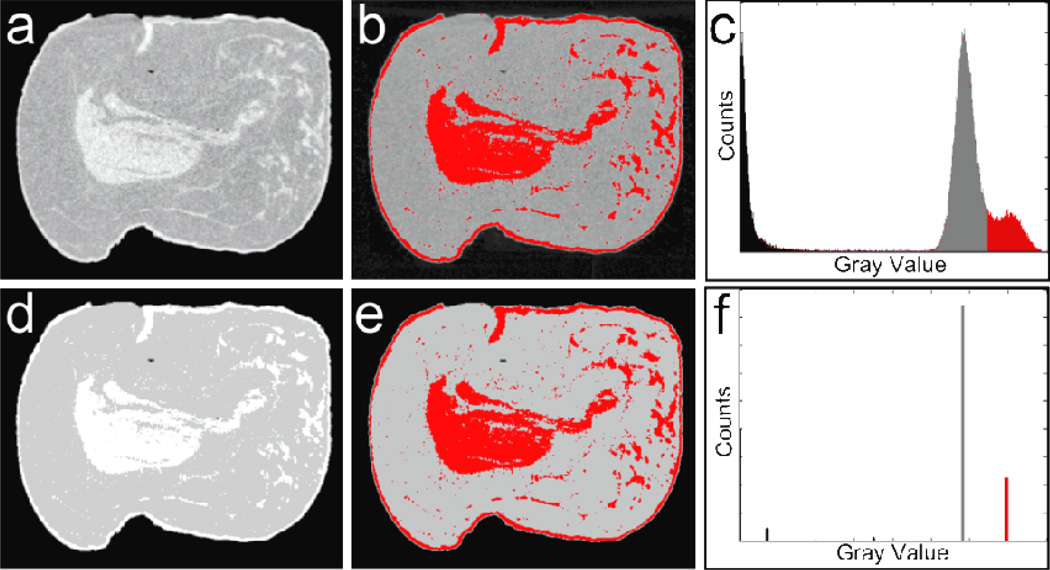
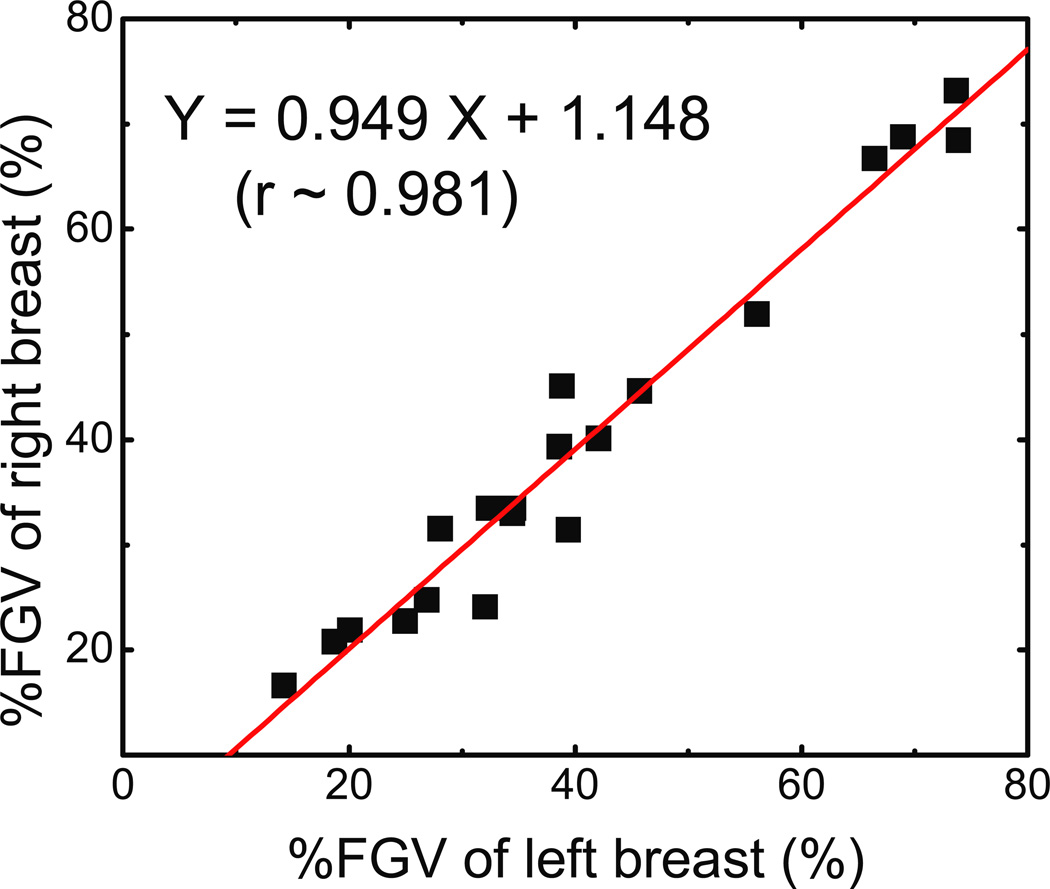
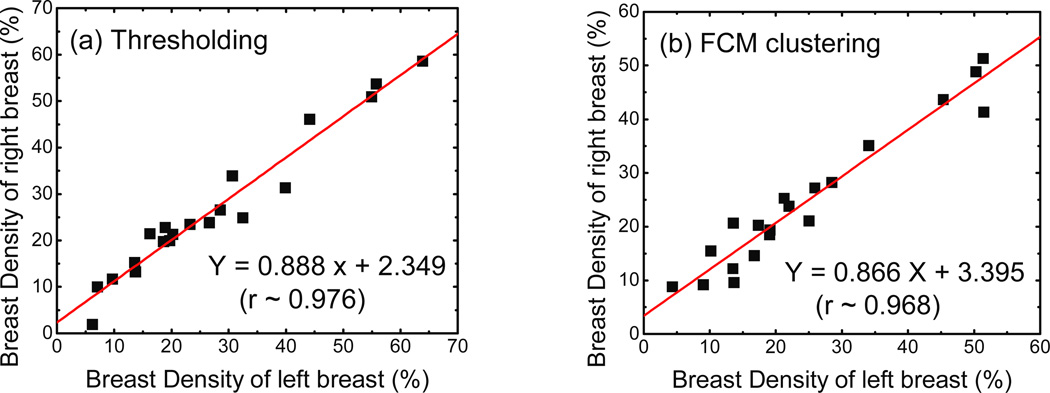
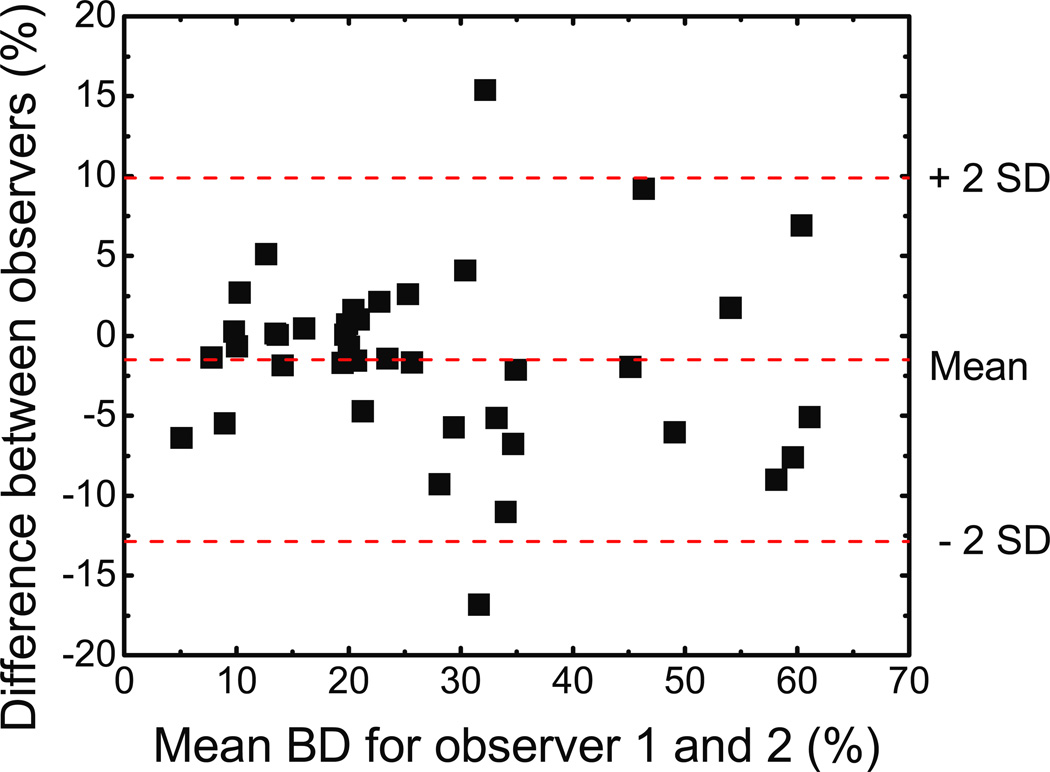
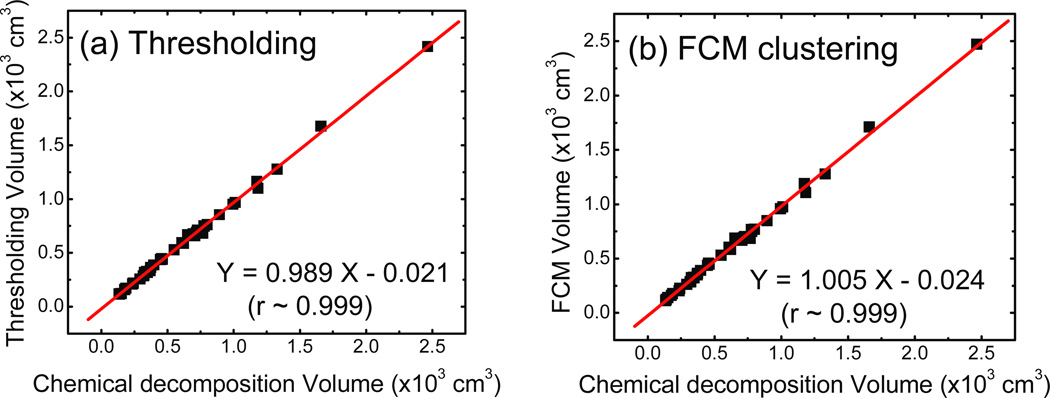
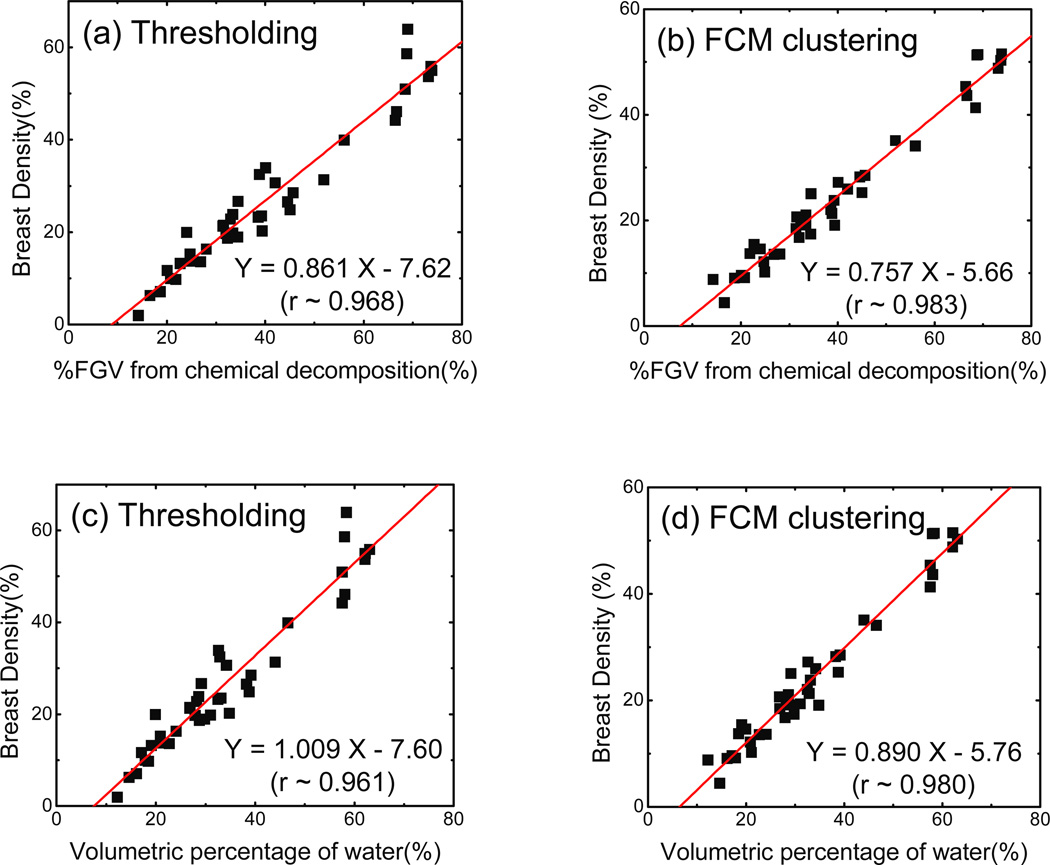
Forty post-mortem breasts were imaged with a flat-panel based cone-beam x-ray CT system at 50 kVp. The feasibility of breast density quantification has been investigated using standard histogram thresholding and an automatic segmentation method based on the fuzzy c-means algorithm (FCM). The breasts were chemically decomposed into water, lipid, and protein immediately after image acquisition was completed. The per cent fibroglandular volume (%FGV) from chemical analysis was used as the gold standard for breast density comparison. Both image-based segmentation techniques showed good precision in breast density quantification with high linear coefficients between the right and left breast of each pair. When comparing with the gold standard using %FGV from chemical analysis, Pearson's r-values were estimated to be 0.983 and 0.968 for the FCM clustering and the histogram thresholding techniques, respectively. The standard error of the estimate was also reduced from 3.92% to 2.45% by applying the automatic clustering technique. The results of the postmortem study suggested that breast tissue can be characterized in terms of water, lipid and protein contents with high accuracy by using chemical analysis, which offers a gold standard for breast density studies comparing different techniques. In the investigated image segmentation techniques, the FCM algorithm had high precision and accuracy in breast density quantification. In comparison to conventional histogram thresholding, it was more efficient and reduced inter-observer variation.


Figures

Figure 1
Figure 1
A flowchart for the chemical decomposition of the breast tissue. The percentages of the water, lipid, and protein contents were measured primarily from the baking, the distillation, and the filtration steps, respectively, with additional corrections from the other procedures.
Figure 2
Figure 2
Comparison of breast mass before imaging and after decomposition. The decomposed mass was calculated as the sum of the water, lipid and protein masses obtained after chemical analysis. A paired t-test revealed that the difference in breast mass is not significant with a p-value of 0.988.
Figure 3
Figure 3
The correlation between volumetric fractions of (a) lipid and (b) protein compared to that of water measured during chemical decomposition. The best-fit line parameters are also given in the figures. A negative association was observed for lipid, while a positive slope was observed for protein. This is expected since adipose tissue contains mostly lipid whereas glandular tissue contains mostly water and protein.
Figure 4
Figure 4
Examples of segmentations for a CT image of a post-mortem breast: (a) the raw reconstructed image; (b) manual glandular selection from histogram thresholding; (c) the raw histogram showing the selected threshold; (d) the raw results of FCM segmentation, (e) the selected glandular clusters, (f) the FCM clustered histogram of the segmented image. Note the similarity in glandular selections and the striking difference in the histograms.
Figure 5
Figure 5
Left-right comparison for the percent fibroglandular volume (%FGV). It is expected that the left and right breasts from the same donor would have similar composition. The linear fit shown on the graph supports this expectation with a standard error of 3.53%.
Figure 6
Figure 6
Left-right comparisons for breast density measurements from (a) thresholding and (b) FCM segmentation. The linear fits for each method are also shown with standard errors of 3.39% and 3.35% respectively. Note that both methods have a Pearson’s r > 0.95. Hence both methods are precise in their measurements of breast density.
Figure 7
Figure 7
Bland-Altman plot for the two observers for thresholding. The mean difference, depicted by the middle dashed line, was −1.5% in breast density, and the standard deviation (SD) of the differences was 5.7%. The limits of agreement are depicted as dashed lines above and below the middle line. The mean difference is small, but the variation between readers becomes significant as the breast density increases.
Figure 8
Figure 8
Total breast volume comparison for the (a) histogram thresholding and (b) FCM clustering techniques as a function of the value determined from chemical decomposition. The linear fits both have slopes that are very close to unity and correlation coefficients greater than 0.99. Hence, volume measurements in the image domain are considered accurate.
Figure 9
Figure 9
Linear correlations between breast densities measured with both (a) the histogram thresholding and (b) the FCM clustering techniques and %FGV from chemical decomposition. The best-fit line and parameters are also given. Both methods correlate strongly with %FGV with Pearson’s A values of 0.968 and 0.983 respectively. The association between breast density and water fraction in the breast is also presented for (c) the histogram thresholding and (d) the FCM clustering techniques. The correlations are very similar to those for %FGV.

Similar articles

Cited by

References

    1. Abràmoff MD, et al. Image processing with ImageJ. Biophontics International. 2004
    1. Agriculture U S D o. CLG-FAT.03. 2009:1–8.
    1. Ahmed MN, et al. A modified fuzzy C-means algorithm for bias field estimation and segmentation of MRI data. IEEE transactions on medical imaging. 2002;21:193–199. - PubMed
    1. Alonzo-Proulx O, et al. Validation of a method for measuring the volumetric breast density from digital mammograms. Phys Med Biol. 2003;55:3027–3044. - PMC - PubMed
    1. Bligh EG, Dyer WJ. A Rapid Method of Total Lipid Extraction and Purification. Can J Biochem Phys. 1959;37:911–917. - PubMed

Publication types