. 2014 Jun 1;522(8):1874-96.
doi: 10.1002/cne.23507.

Allelic specificity of Ube3a expression in the mouse brain during postnatal development

Affiliations

Allelic specificity of Ube3a expression in the mouse brain during postnatal development

Matthew C Judson et al. J Comp Neurol. .

Abstract

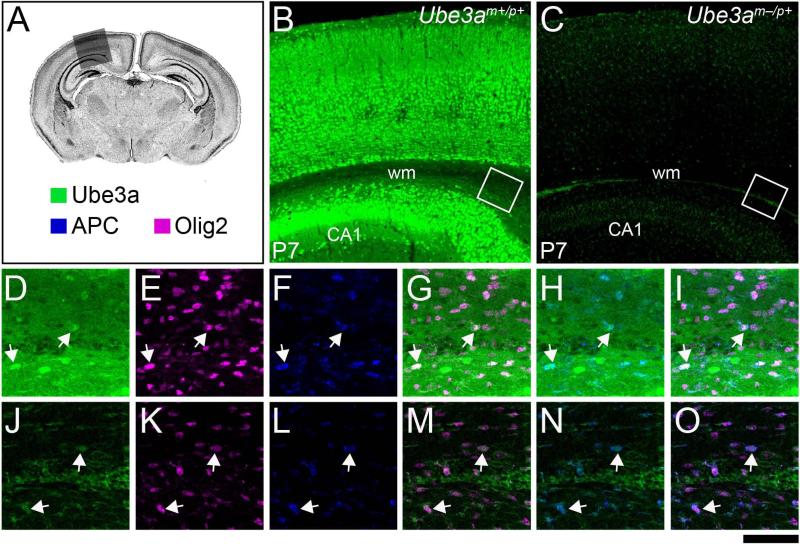
Genetic alterations of the maternal UBE3A allele result in Angelman syndrome (AS), a neurodevelopmental disorder characterized by severe developmental delay, lack of speech, and difficulty with movement and balance. The combined effects of maternal UBE3A mutation and cell type-specific epigenetic silencing of paternal UBE3A are hypothesized to result in a complete loss of functional UBE3A protein in neurons. However, the allelic specificity of UBE3A expression in neurons and other cell types in the brain has yet to be characterized throughout development, including the early postnatal period when AS phenotypes emerge. Here we define maternal and paternal allele-specific Ube3a protein expression throughout postnatal brain development in the mouse, a species that exhibits orthologous epigenetic silencing of paternal Ube3a in neurons and AS-like behavioral phenotypes subsequent to maternal Ube3a deletion. We find that neurons downregulate paternal Ube3a protein expression as they mature and, with the exception of neurons born from postnatal stem cell niches, do not express detectable paternal Ube3a beyond the first postnatal week. By contrast, neurons express maternal Ube3a throughout postnatal development, during which time localization of the protein becomes increasingly nuclear. Unlike neurons, astrocytes and oligodendrotyes biallelically express Ube3a. Notably, mature oligodendrocytes emerge as the predominant Ube3a-expressing glial cell type in the cortex and white matter tracts during postnatal development. These findings demonstrate the spatiotemporal characteristics of allele-specific Ube3a expression in key brain cell types, thereby improving our understanding of the developmental parameters of paternal Ube3a silencing and the cellular basis of AS.

Keywords: AS model mice; Angelman syndrome; E6-AP; epigenetic silencing; genomic imprinting.


Figures

Figure 1
Figure 1
Profiling Ube3a expression in the postnatal brain using an established immunostaining protocol. A and B: DAB immunostaining for Ube3a (as per Gustin et al., 2010) in coronal brain sections from wild-type (A, Ube3am+/p+) and AS (B, Ube3am–/p+) mice across postnatal development. Lowmagnification reveals broadly distributed Ube3a staining in the brain at all ages, which is grossly absent in Ube3am–/p+ mice (B). C-G: In Ube3am+/p+ mice, intermediate-magnification (corresponding to boxed regions in panel A) reveals discrete patterns of Ube3a staining in the deepest neocortical layers (arrows, panels C, D) and in patches of striatal cells (double arrows, panels C, D) from P0-P7. Ube3a staining within the neocortex and striatum becomes more evenly distributed by P14 (E). This staining pattern persists into adolescence (F) and throughout adulthood (G). H-L: Intermediate-magnification of boxed regions corresponding to panel B demonstrate lack of specific staining patterns in Ube3am–/p+ mice. M-Q: Highmagnification (boxed regions, panels C-G), provides greater resolution of Ube3a staining patterns in deep neocortical layers (arrows, panels M, N) and in striatal patches (double arrows, panels M, N), which become less salient over development (O-Q). R-V: High-magnification corresponding to boxed regions in H-L. No specific staining is detected in Ube3am–/p+ images, confirming that paternal Ube3a immunoreactivity is not reliably detected in the brain at any postnatal age using this protocol. Ctx, neocortex; Str, striatum; wm, white matter. Scale bar: 2 mm for A and B; 650 μm for C-L; 170 μm for M-V.
Figure 2
Figure 2
Improved immunofluorescent detection of Ube3a in the postnatal brain. A-C: Immunofluorescent staining for Ube3a in coronal sections from wild-type (Ube3am+/p+) mice at P0 (A), P7 (B), and P28 (C). Gross patterns of staining during the first postnatal week are nearly identical to those observed with DAB staining, with notable Ube3a immunoreactivity in deep laminae of the neocortex (arrows, A, B) as well as in patches of striatal cells (double arrow, A); staining is more uniformly distributed at P28 (C). D-F: Immunofluorescent staining for paternal Ube3a in matched brain sections from AS mouse (Ube3am–/p+) littermates. Low levels of paternal Ube3a expression are consistently observed during postnatal development in specific structures and cell types throughout the brain, especially in the superficial neocortex at P0 (D). G-I: Gross immnofluorescent staining for Ube3a is not observed in negative control sections from double-knockout (Ube3am–/p–) mice. J-L: High-magnification of the boxed regions in D-F reveals paternal Ube3a staining in presumptive glia (arrowheads). M-O: No specific staining is apparent in corresponding high-magnification images from Ube3am–/p– mice. Ctx, neocortex; Str, striatum. Scale bar: 2 mm for A-I; 120 μm for J-O.
Figure 3
Figure 3
Ube3a expression is salient in the striosomes and subplate during early postnatal development in wild-type (Ube3am+/p+) mice. A-H: Images of Ube3a and DARPP-32 immunostaining in P0 (A-D) and P7 (EH) brains. Increased magnification shows that salient Ube3a staining in the P0 striatum is specific to DARPP-32-positive striosomes (arrows, B-D). Striosomal Ube3a staining is less salient by P7 (arrows, FH). I-P: Images of Ube3a and Cplx3 immunoreactivity in the P0 (I-L) and P7 (M-P) brains. In the perinatal (J-L) and early postnatal (N-P) neocortex, Cplx3-positive subplate neurons exhibit intense Ube3a staining with a predominantly nuclear localization. Ctx, neocortex; wm, white matter. Scale bar: 435 μm for A, E, I, and M; 70 μm for B-D, F-H, J-L, and N-P.
Figure 4
Figure 4
Developmental changes in Ube3a expression reflect laminar gradients of neocortical maturation. A-C: Low-magnification images of Ube3a immunostaining in the developing neocortex of wildtype (Ube3am+/p+) mice. At P0, subplate neurons most prominently exhibit nuclear Ube3a immunoreactivity (A). By P7, neurons with notable nuclear staining are seen throughout the infragranular layers (B), but are not observed in supragranular layers until later (C). D-L: Within the superficial cortex, the developmental shift in subcellular Ube3a localization is apparent in high-magnification images captured using thin (1.2 μm) optical sectioning. Note the increase in Ube3a staining (D-F) in the nuclear compartment (labeled with DAPI, G-I and J-L) from P0 to P28. Conversely, Ube3a staining in dendritic processes (arrows) progressively declines over the first postnatal month. cp, cortical plate; sp, subplate. Scale bar: 225 μm for A-C; 25 μm for D-L.
Figure 5
Figure 5
Immature neurons of the perinatal cortex express paternal Ube3a. A-N: Images of paternal Ube3a and NeuN immunostaining in the developing neocortex of AS (Ube3am–/p+) mice. Paternal Ube3a is more prominent at P0 (A) than at P0 (H), when a distinct deep (low) to superficial (high) gradient of staining is observed. At P0, the paternal Ube3a laminar gradient opposes the staining gradient for NeuN, a mature neuron marker, as shown in high-magnification images captured using thin (1.2 μm) optical sectioning (BD). In digitally zoomed images (E-G), paternal Ube3a staining is apparent in presumptive immature neurons (double arrows) beyond the superficial extent of NeuN staining and in nearby, weakly NeuN-positive neurons (arrows) slightly deeper in the cortical plate. At P7, only presumptive NeuN-negative glia show paternal Ube3a staining, as shown with high-magnification (I-K; arrow, L-N). O: Western blotting of total cortical and hippocampal lysates from P0 and P7 wild-type and AS mouse littermates. Paternal Ube3a is more abundant in AS lysates at P0 than at P7, corroborating the immunostaining data. cp, cortical plate; wm, white matter. Scale bar: 210 μm for A and H; 35 μm for B-D and I-K; 20 μm for E-G and L-N.
Figure 6
Figure 6
Immature granule cells of the hippocampus and cerebellum express paternal Ube3a. A: Lowmagnification image of paternal Ube3a immunostaining in the dentate gyrus of P7 AS (Ube3am–/p+) mice. Note the relatively intense staining in the inner band of neurons adjacent to the hilus. B-G: Highmagnification images captured using thin (1.2 μm) optical sectioning show that paternal Ube3a staining in the dentate gyrus (panel B) is inversely correlated with staining for the mature neuronal marker NeuN (C and D). Paternal Ube3a is clearly observed in weakly NeuN-positive neurons (arrows) in the inner dentate granule cell layers, whereas it is seemingly absent from strongly NeuN-positive neurons in outer layers (double arrows) as shown in corresponding, digitally zoomed images (E-G). H: Low-magnification image of paternal Ube3a staining in the P7 cerebellum. Note the staining enrichment in this relatively immature structure. I-N: High-magnification shows enriched paternal Ube3a staining deep within the external granule cell layer (panel I), localized to immature neurons that are weakly NeuN-positive (J and K). In digitally zoomed images (L-N), paternal Ube3a/NeuN co-positive neurons are shown beginning (arrows) or continuing (double arrow) their migration past Purkinje cells (asterisks) into the internal granule cell layer. CA1, Cornu Ammonis area 1; H, hilus; IC, inferior colliculus; igl, internal granule layer; ml, molecular layer; egl, external granule layer. Scale bar: 105 μm for A; 275 μm for H; 40 μm for B-D and I-K; 19 μm for E-G and L-N.
Figure 7
Figure 7
Postnatal hippocampal stem cells biallelically express Ube3a. A-C: Low-magnification images of Ube3a staining in the dentate gyrus of P28 wild-type (A, Ube3am+/p+), AS (B, Ube3am–/p+), and doubleknockout (C, Ube3am–/p–) mice. Paternal Ube3a staining is conspicuous within the inner granule cell layer (B) but absent in Ube3am–/p– mice (C). The signal gain in C was digitally increased so that low levels of nonspecific staining could be appreciated. D-I: High-magnification of the boxed region in B, depicting paternal Ube3a, Nestin, and Ki67 staining. Paternal Ube3a (D) and Nestin (E) colocalize (G). Paternal Ube3a and Ki67 (F) also colocalize (H). Cells that express all three markers (arrow, I) are readily detected. J-L: Low-magnification images of Ube3a-YFP staining in the dentate gyrus of P28 maternal Ube3a-YFP (J, Ube3amYFP/p+), paternal Ube3a-YFP (K, Ube3am+/pYFP), and wild-type (L, Ube3am+/p+) mice. Maternal (J) and paternal (K) Ube3a-YFP staining in the inner granule cell layer is clearly evident, whereas there is no Ube3a-YFP staining in wild-type mice (L). M-R: High-magnification of the boxed region in J, depicting maternal Ube3a-YFP, Nestin, and Ki67 staining. S-X: High-magnification of the boxed region in K, depicting paternal Ube3a-YFP, Nestin, and Ki67 staining. Maternal (arrow, P-R) and paternal (arrow, V-X) Ube3a-YFPexpressing cells are found to co-express Nestin and Ki67, indicating that Ube3a is biallelically expressed by proliferating stem cells in the postnatal dentate gyrus. CA1, Cornu Ammonis area 1; DG, dentate
Figure 8
Figure 8
Olig2-expressing glia express paternal Ube3a during gliogenesis. A: DAPI-stained coronal section from a P7 wild-type mouse. The shaded box indicates the region of interest and the color key indicates the identity of immunostaining targets. B and C: Low-magnification images of Ube3a immunostaining in wildtype (B, Ube3am+/p+) and AS (C, Ube3am–/p+) mice in the region of interest. The paternal Ube3a staining that remains in AS mice is uniformly distributed in small cells reminiscent of glia (C). D-I: Highmagnification of the boxed region in B, depicting Ube3a, Olig2, and APC staining in the subcortical white matter. Against a backdrop of Ube3a-stained axons, small Ube3a-stained glia are seen (D), nearly all of which are co-stained with Olig2 (E and G). A subset of these glia is heavily co-stained with APC (arrows, F, H, and I). J-O: High-magnification of the boxed region in C, depicting paternal Ube3a, Olig2, and APC staining in the subcortical white matter. Paternal Ube3a-stained glia are particularly salient as surrounding axonal staining is lost. Nearly all glia co-express Olig2 (K and M) but only a subset strongly co-express APC (arrows, L, N, and O). CA1, Cornu Ammonis area 1; wm, white matter. Scale bar: 275 μm for B and C; 60 μm for D-O.
Figure 9
Figure 9
Quantification of paternal Ube3a co-localization with glial markers. A and H: Images of P7 (A) and P28 (H) Ube3am–/p+ somatosensory cortex stained for paternal Ube3a and the glial markers Olig2 and APC. The boxed regions indicate the areas sampled for co-localization analysis. Dashed lines indicate white matter boundaries. B, C, E, and F and I, J, L, and M: Paternal Ube3a co-localization with glial markers in digitally zoomed images of P7 (B, C, E, and F) and P28 (I, J, L, and M) somatosensory grey matter. Arrows indicate Ube3a co-localization with Olig2 in the absence of APC; double arrows indicate co-localization of Ube3a and Olig2 with weak APC staining (APC Lo); arrowheads indicate colocalization of Ube3a and Olig2 with APC staining that is still visible after thresholding (APC Hi). Thresholding for APC Hi helped to select for the intense APC labeling characteristic of mature oligodendrocytes. D, G, K, and N: Proportionality of distinct paternal Ube3a-expressing glial subpopulations in the grey matter (D and K) and white matter (G and N) of somatosensory cortex at P7 (D and G) and P28 (K and N). Values represent the mean percentage of total paternal Ube3a-stained cells that co-stained with the indicated combination of immunofluorescent markers. O: Pie chart color key. N = 4 animals per developmental time point. Optical section thickness = 1.4 μm. Scale bar: 280 μm for A and H; 60 μm for B, C, E, and F and I, J, L, and M.
Figure 10
Figure 10
Olig2-positive glia biallelically express Ube3a-YFP during gliogenesis. A: DAPI-stained coronal section from a P7 wild-type mouse. The shaded box indicates the region of interest and the color key indicates the identity of immunostaining targets. B-D: Low-magnification images of Ube3a-YFP immunostaining in maternal Ube3a-YFP (B, Ube3amYFP/p+), paternal Ube3a-YFP (C, Ube3am+/pYFP), and wildtype (D, Ube3am+/p+) mice. Relative to maternal Ube3a-YFP staining (B), paternal Ube3a-YFP staining (C) is sparse and evenly distributed in small cells. No specific YFP staining is observed in wild-type mice (D). E-J: High-magnification of the boxed region in B, depicting maternal Ube3a-YFP, Olig2, and APC staining in the subcortical white matter. Stained glial cells are difficult to notice amid axons that are also maternal Ube3a-YFP-positive (E). Nearly all maternal Ube3a-YFP-stained glia are Olig2-stained (F and H) and a minor subset also co-stain with APC (arrows, G, I, and J). K-P: High-magnification of the boxed region in C, depicting paternal Ube3a-YFP, Olig2, and APC staining in the subcortical white matter. There is no apparent paternal Ube3a-YFP staining in axons, so stained glia are readily detected (K). Most paternal Ube3a-YFP stained glia also express Olig2 (L and N) and a few also express APC (arrows, M, O, and P). CA1, Cornu Ammonis area 1; wm, white matter. Scale bar: 340 μm for B-D; 60 μm for E-P.
Figure 11
Figure 11
Co-expression of paternal Ube3a and GFAP. A-D: Paternal Ube3a (B), NeuN (C), and GFAP (D) staining in the P7 Ube3am–/p+ somatosensory cortex. E-H: Paternal Ube3a (F), NeuN (G), and GFAP (H) staining in the P7 Ube3am–/p+ hippocampus. I-L: Paternal Ube3a (J), NeuN (K), and GFAP (L) staining in the P28 Ube3am–/p+ hippocampus. Arrowheads indicate representative glia that are clearly co-stained with both paternal Ube3a and GFAP. pyr, pyramidal layer of hippocampus; rad, stratum radiatum of hippocampus. Optical section thickness = 1.4 μm. Scale bar: 45 μm for all panels.
Figure 12
Figure 12
Mature oligodendrocytes express paternal Ube3a. A: DAPI-stained coronal section from a P28 wild-type mouse. The shaded box indicates the region of interest and the color key indicates the identity of immunostaining targets. B-D: Low-magnification images of Ube3a immunostaining in wild-type (B, Ube3am+/p+), AS (C, Ube3am–/p+), and double-knockout (D, Ube3am–/p–) mice in the region of interest. The majority of staining observed in wild-type mice (B) is lost in AS mice (C), but glial profiles that are concentrated in the white matter persist. These patterns are absent in double-knockout mice (D). E-J: High-magnification of the boxed region in B, depicting Ube3a, Olig2, and APC staining in the callosum. Glial cells and surrounding axons are stained for Ube3a (E). Most Ube3a-stained glia in this myelinated tract costain for Olig2 (F and H) and APC (arrows, G, I, and J). K-P: High-magnification of the boxed region in C, depicting paternal Ube3a, Olig2, and APC staining in the callosum. Paternal Ube3a staining in glia is apparent in the absence of axonal maternal Ube3a staining (K). Paternal Ube3a-stained glia in the callosum are frequently co-stained with both Olig2 (L and N) and the mature oligodendrocyte marker APC (arrows, M, O, and P). cc, corpus callosum; dhc, dorsal hippocampal commissure. Scale bar: 340 μm for B-D; 60 μm for E-P.
Figure 13
Figure 13
Mature oligodendrocytes biallelically express Ube3a-YFP. A: DAPI-stained coronal section from a P28 wild-type mouse. The shaded box indicates the region of interest and the color key indicates the identity of immunostaining targets. B-D: Low-magnification images of Ube3a-YFP immunostaining in maternal Ube3a-YFP (B, Ube3amYFP/p+), paternal Ube3a-YFP (C, Ube3am+/pYFP), and wild-type (D, Ube3am+/p+) mice. Maternal Ube3a-YFP staining is intense and distributed broadly in neurons (B), whereas paternal Ube3a-YFP staining is concentrated in callosal glia (C). These patterns are absent in wild-type mice (D). EJ: High-magnification of the boxed region in B, depicting maternal Ube3a-YFP, Olig2, and APC staining in the callosum. Maternal Ube3a-YFP is present in glia (E) which are largely Olig2 (F and H) and APC co-positive (arrows, G, I, and J). K-P: High-magnification of the boxed region in C, depicting paternal Ube3a-YFP, Olig2, and APC staining in the callosum. Paternal Ube3a-YFP staining is present in glia but not axons in the callosum (K). Paternal Ube3a-YFP-stained glia are nearly always co-stained with Olig2 (L and N) and frequently co-stained with the mature oligodendrocyte marker APC (arrows, M, O, and P). cc, corpus callosum; dhc, dorsal hippocampal commissure. Scale bar: 340 μm for B-D; 60 μm for E-P.

References

    1. Albrecht U, Sutcliffe JS, Cattanach BM, Beechey CV, Armstrong D, Eichele G, Beaudet AL. Imprinted expression of the murine Angelman syndrome gene, Ube3a, in hippocampal and Purkinje neurons. Nature genetics. 1997;17(1):75–78. - PubMed
    1. Altman J, Das GD. Autoradiographic and histological studies of postnatal neurogenesis. I. A longitudinal investigation of the kinetics, migration and transformation of cells incorporating tritiated thymidine in neonate rats, with special reference to postnatal neurogenesis in some brain regions. The Journal of comparative neurology. 1966;126(3):337–389. - PubMed
    1. Angevine JB, Jr., Sidman RL. Autoradiographic study of cell migration during histogenesis of cerebral cortex in the mouse. Nature. 1961;192:766–768. - PubMed
    1. Bandeira F, Lent R, Herculano-Houzel S. Changing numbers of neuronal and nonneuronal cells underlie postnatal brain growth in the rat. Proceedings of the National Academy of Sciences of the United States of America. 2009;106(33):14108–14113. - PMC - PubMed
    1. Bayer SA, Altman J. The effects of X-irradiation on the postnatally-forming granule cell populations in the olfactory bulb, hippocampus, and cerebellum of the rat. Experimental neurology. 1975;48(1):167–174. - PubMed

Publication types

Substances