Retinoid uptake, processing, and secretion in human iPS-RPE support the visual cycle
- PMID: 24255038
- PMCID: PMC4588713
- DOI: 10.1167/iovs.13-11740
Retinoid uptake, processing, and secretion in human iPS-RPE support the visual cycle
Abstract
Purpose: Retinal pigmented epithelium derived from human induced pluripotent stem (iPS) cells (iPS-RPE) may be a source of cells for transplantation. For this reason, it is essential to determine the functional competence of iPS-RPE. One key role of the RPE is uptake and processing of retinoids via the visual cycle. The purpose of this study is to investigate the expression of visual cycle proteins and the functional ability of the visual cycle in iPS-RPE.
Methods: iPS-RPE was derived from human iPS cells. Immunocytochemistry, RT-PCR, and Western blot analysis were used to detect expression of RPE genes lecithin-retinol acyl transferase (LRAT), RPE65, cellular retinaldehyde-binding protein (CRALBP), and pigment epithelium-derived factor (PEDF). All-trans retinol was delivered to cultured cells or whole cell homogenate to assess the ability of the iPS-RPE to process retinoids.
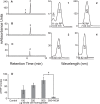
Results: Cultured iPS-RPE expresses visual cycle genes LRAT, CRALBP, and RPE65. After incubation with all-trans retinol, iPS-RPE synthesized up to 2942 ± 551 pmol/mg protein all-trans retinyl esters. Inhibition of LRAT with N-ethylmaleimide (NEM) prevented retinyl ester synthesis. Significantly, after incubation with all-trans retinol, iPS-RPE released 188 ± 88 pmol/mg protein 11-cis retinaldehyde into the culture media.
Conclusions: iPS-RPE develops classic RPE characteristics and maintains expression of visual cycle proteins. The results of this study confirm that iPS-RPE possesses the machinery to process retinoids for support of visual pigment regeneration. Inhibition of all-trans retinyl ester accumulation by NEM confirms LRAT is active in iPS-RPE. Finally, the detection of 11-cis retinaldehyde in the culture medium demonstrates the cells' ability to process retinoids through the visual cycle. This study demonstrates expression of key visual cycle machinery and complete visual cycle activity in iPS-RPE.
Keywords: induced-pluripotent stem cell; retinal pigment epithelium; visual cycle.
Figures


Similar articles
-
Retinoid processing proteins in the ocular ciliary epithelium.Mol Vis. 2005 May 18;11:356-65. Mol Vis. 2005. PMID: 15928609
-
Acute radiolabeling of retinoids in eye tissues of normal and rpe65-deficient mice.Invest Ophthalmol Vis Sci. 2003 Apr;44(4):1435-46. doi: 10.1167/iovs.02-0679. Invest Ophthalmol Vis Sci. 2003. PMID: 12657577
-
Origin and evolution of retinoid isomerization machinery in vertebrate visual cycle: hint from jawless vertebrates.PLoS One. 2012;7(11):e49975. doi: 10.1371/journal.pone.0049975. Epub 2012 Nov 27. PLoS One. 2012. PMID: 23209628 Free PMC article.
-
Lecithin:Retinol Acyltransferase: A Key Enzyme Involved in the Retinoid (visual) Cycle.Biochemistry. 2016 Jun 7;55(22):3082-91. doi: 10.1021/acs.biochem.6b00319. Epub 2016 May 23. Biochemistry. 2016. PMID: 27183166 Free PMC article. Review.
-
Retinoid Processing in Induced Pluripotent Stem Cell-Derived Retinal Pigment Epithelium Cultures.Prog Mol Biol Transl Sci. 2015;134:477-90. doi: 10.1016/bs.pmbts.2015.06.004. Epub 2015 Jul 9. Prog Mol Biol Transl Sci. 2015. PMID: 26310172 Free PMC article. Review.
Cited by
-
Retinoid Synthesis Regulation by Retinal Cells in Health and Disease.Cells. 2024 May 18;13(10):871. doi: 10.3390/cells13100871. Cells. 2024. PMID: 38786093 Free PMC article.
-
Cell-based therapeutic strategies for replacement and preservation in retinal degenerative diseases.Prog Retin Eye Res. 2017 May;58:1-27. doi: 10.1016/j.preteyeres.2017.01.004. Epub 2017 Jan 19. Prog Retin Eye Res. 2017. PMID: 28111323 Free PMC article. Review.
-
Trichostatin A Inhibits Retinal Pigmented Epithelium Activation in an In Vitro Model of Proliferative Vitreoretinopathy.J Ocul Pharmacol Ther. 2016 Sep;32(7):415-24. doi: 10.1089/jop.2016.0038. Epub 2016 Aug 5. J Ocul Pharmacol Ther. 2016. PMID: 27494828 Free PMC article.
-
Functional Voltage-Gated Calcium Channels Are Present in Human Embryonic Stem Cell-Derived Retinal Pigment Epithelium.Stem Cells Transl Med. 2019 Feb;8(2):179-193. doi: 10.1002/sctm.18-0026. Epub 2018 Nov 4. Stem Cells Transl Med. 2019. PMID: 30394009 Free PMC article.
-
Differentiation/Purification Protocol for Retinal Pigment Epithelium from Mouse Induced Pluripotent Stem Cells as a Research Tool.PLoS One. 2016 Jul 6;11(7):e0158282. doi: 10.1371/journal.pone.0158282. eCollection 2016. PLoS One. 2016. PMID: 27385038 Free PMC article.
References
-
- La Cour M, Tezel T. The retinal pigment epithelium. Adv Organ Biol. 2006; 10: 253–273.
-
- Dowling JE. Chemistry of visual adaptation in the rat. Nature. 1960; 188: 114–118. - PubMed
-
- McBee JK, Palczewski K, Baehr W, Pepperberg DR. Confronting complexity: the interlink of phototransduction and retinoid metabolism in the vertebrate retina. Prog Retin Eye Res. 2001; 20: 469–529. - PubMed
-
- Zimmerman WF. The distribution and proportions of vitamin A compounds during the visual cycle in the rat. Vision Res. 1974; 14: 795–802. - PubMed
-
- Saari JC, Bredberg DL. Lecithin: retinol acyltransferase in retinal pigment epithelial microsomes. J Biol Chem. 1989; 264: 8636–8640. - PubMed
Publication types
MeSH terms
Substances
Grants and funding
LinkOut - more resources
Full Text Sources
Other Literature Sources
Miscellaneous

