. 2014 Jan 29;55(1):574-86.
doi: 10.1167/iovs.13-13245.

Longitudinal detection of optic nerve head changes by spectral domain optical coherence tomography in early experimental glaucoma

Affiliations

Longitudinal detection of optic nerve head changes by spectral domain optical coherence tomography in early experimental glaucoma

Lin He et al. Invest Ophthalmol Vis Sci. .

Abstract

Purpose: We determined if the detection of spectral-domain optical coherence tomography (SDOCT) optic nerve head (ONH) change precedes the detection of confocal scanning laser tomography (CSLT) ONH surface, SDOCT retinal nerve fiber layer (RNFL), scanning laser perimetry (SLP), and multifocal electroretinography (mfERG) change in eight experimental glaucoma (EG) eyes.

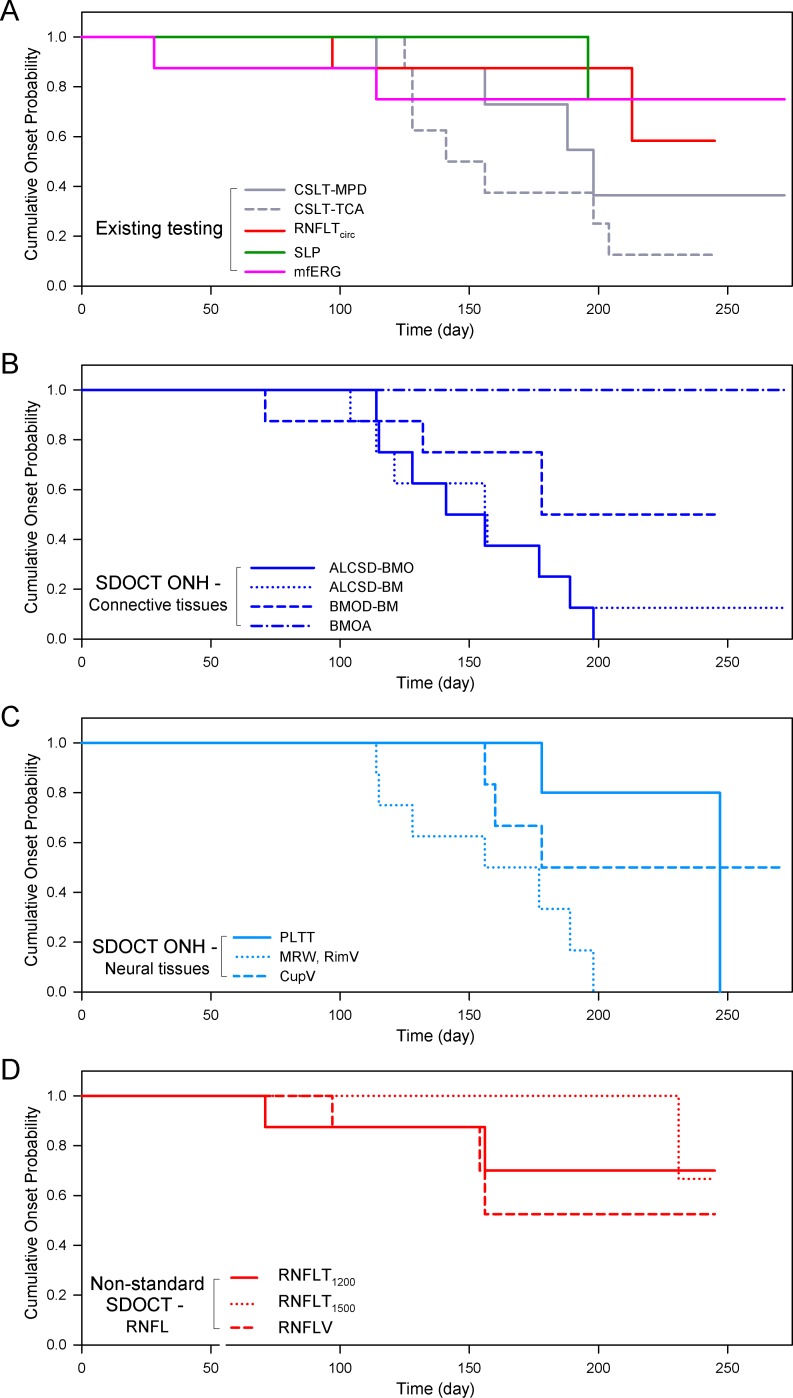
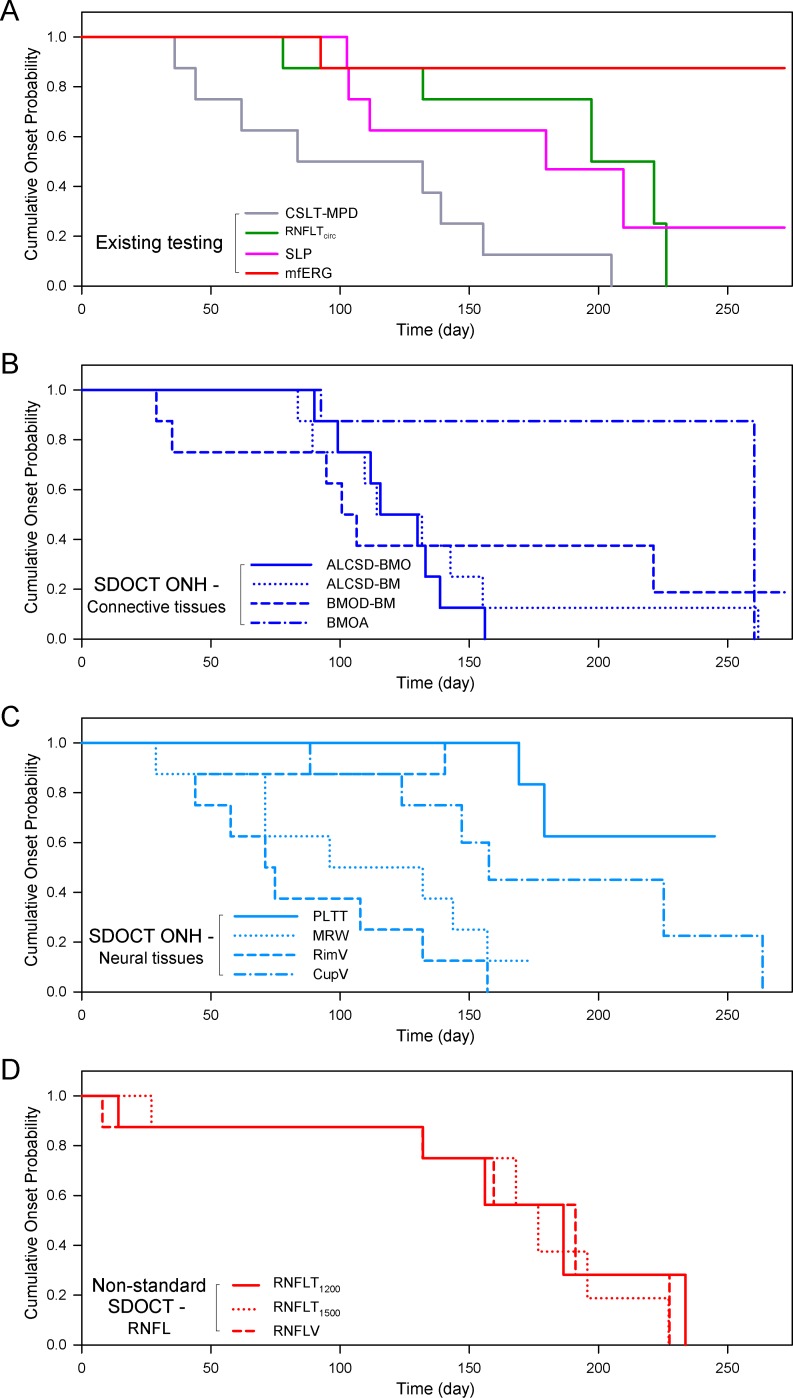
Methods: Both eyes from eight monkeys were tested at least three times at baseline, and then every 2 weeks following laser-induced chronic unilateral IOP elevation. Event and trend-based definitions of onset in the control and EG eyes for 11 SDOCT neural and connective tissue, CSLT surface, SDOCT RNFL, SLP, and mfERG parameters were explored. The frequency and timing of onset for each parameter were compared using a logrank test.

Results: Maximum post-laser IOP was 18 to 42 mm Hg in the EG eyes and 12 to 20 mm Hg in the control eyes. For event- and trend-based analyses, onsets were achieved earliest and most frequently within the ONH neural and connective tissues using SDOCT, and at the ONH surface using CSLT. SDOCT ONH neural and connective tissue parameter change preceded or coincided with CSLT ONH surface change in most EG eyes. The SDOCT and SLP measures of RNFL thickness, and mfERG measures of visual function demonstrated similar onset rates, but occurred later than SDOCT ONH and CSLT surface change, and in fewer eyes.

Conclusions: SDOCT ONH change detection commonly precedes or coincides with CSLT ONH surface change detection, and consistently precedes RNFLT, SLP, and mfERG change detection in monkey experimental glaucoma.

Keywords: Bruch's membrane opening; glaucoma; lamina cribrosa; optic nerve head; optical coherence tomography; retinal nerve fiber layer.


Figures

Figure 1
Figure 1
Original and delineated SDOCT ONH data sets in a normal monkey eye. One of two B-scans was delineated and, thus, yielded 40 delineated data sets for each monkey eye at a time. Green lines/points: ILM. Blue lines/points: outer boundary of the RNFL. Orange lines/points: BM/RPE. Red points: BMO. Purple points: BTE. Yellow points: ALCS.
Figure 2
Figure 2
The SDOCT parameters grouped by target tissue. (A) ONH connective tissues. SDOCT ONH connective tissue parameters are designed to detect connective tissue deformation (reversible) and/or remodeling (permanent). ALCS depth (blue arrows) is measured at each delineated ALCS point as the perpendicular distance from the BMO reference plane (red line, top) and BM reference plane (orange line) defined by two delineated BM points at 1500 μm eccentricity from the BMO centroid (middle). BMO Depth is measured at each delineated BMO point as the perpendicular distance from the BM reference plane (orange line, bottom).
Figure 2
Figure 2
(B, C) The SDOCT parameters grouped by target tissue (continued). (B) ONH neural tissues. Neural tissue parameters are designed to detect neural tissue changes that occur either due to neural tissue damage or secondary to connective tissue deformation. PLTT is measured as the normal from the tangent to the ALCS to the ILM (green line, top). The MRW (blue arrows) is measured at each delineated BMO point (red) as the minimum distance to ILM (upper middle). When viewed in a 3-D domain, MRW can be translated into minimum rim area (MRA). Rim volume (purple) is calculated from the volume bounded by ILM (green), BMO reference plane (red), and perpendicular line through the BMO (lower middle). Cup volume (grey) is generated from the volume between ILM B-spline surface and the BMO reference plane (bottom). (C) Non-standard peripapillary RNFL. RNFLT1200 is measured on either side of the posterior RNFL boundary (turquoise line) at ILM points that are 1200 μm from the centroid of the 80 delineated BMO points (the BMO centroid). Similarly, RNFLT1500 is measured at 1500 μm from the BMO centroid (top). The volume between RNFLT1200 and RNFLT1500 is defined as RNFL volume (pink, bottom).
Figure 3
Figure 3
Event-based (A) and trend-based (B) onset criteria. (A) Longitudinal ALCSD-BMO data for eyes of the representative young monkey (Monkey Y3). Changes from mean ALCSD-BMO at baseline (in vertical axis) were plotted for the EG (solid square) and the contralateral control eye (open square) at each imaging session. All data were normalized to the mean baseline value to reflect the changes to baselines. Eye-specific upper and lower 95% CIs for each eye were determined using the baseline testing session and a t-distribution (solid lines EG eye, dashed lines control eye). The number of days in the x-axis was normalized to the first day of laser (day 0). Onset of change in either eye (filled arrow) was defined to occur at the first post-laser testing session in which the value fell out of the CI, that was confirmed on the next two testing sessions (open arrows, onset confirmed ×2). (B) Longitudinal ALCSD-BMO data for EG eyes of the same representative young monkey (Monkey Y3). The trend-based onset (x0 = 139) was determined by the intersection in a segmental fit including one horizontal and one sloped solid lines. When the fit is statistically different from the mean of ALCSD-BMO data (horizontal dashed line, implying no change), the fit and x0 were considered meaningful and, therefore, was counted as an achieved onset (Methods).
Figure 4
Figure 4
Kaplan-Meier analysis of event-based onset in the eight EG eyes by post-laser time, testing modality, and SDOCT parameter type. (A) Existing testing modalities, including CSLT, SLP, and mfERG. (B) SDOCT ONH connective tissue parameters. (C) SDOCT ONH neural tissue parameters. (D) SDOCT RNFL parameters. When compared at similar post-laser days, change detection in the SDOCT ONH parameters ALCSD-BMO and MRW/rim volume, and in the CSLT ONH surface parameters occurred earliest and was most frequent in these eight EG eyes.
Figure 5
Figure 5
Kaplan-Meier analysis of trend-based onset in the eight EG eyes by post-laser time, testing modality, and SDOCT parameter type. (A) Existing testing modalities, including CSLT, SLP, and mfERG. (B) SDOCT ONH connective tissue parameters. (C) SDOCT ONH neural tissue parameters. (D) SDOCT RNFL parameters. Similar to Figure 4, when compared at similar levels of EG eye cumulative IOP insult, change detection in the SDOCT ONH parameters ALCSD-BMO, MRW, and rim volume occurred earliest and was most frequent in these eight EG eyes.

References

    1. Minckler DS, Bunt AH, Johanson GW. Orthograde and retrograde axoplasmic transport during acute ocular hypertension in the monkey. Invest Ophthalmol Vis Sci. 1977; 16: 426–441 - PubMed
    1. Quigley HA, Addicks EM, Green WR, Maumenee AE. Optic nerve damage in human glaucoma. II. The site of injury and susceptibility to damage. Arch Ophthalmol. 1981; 99: 635–649 - PubMed
    1. Yang H, Downs JC, Bellezza AJ, Thompson H, Burgoyne CF. 3-D histomorphometry of the normal and early glaucomatous monkey optic nerve head: prelaminar neural tissues and cupping. Invest Ophthalmol Vis Sci. 2007; 48: 5068–5084 - PubMed
    1. Bellezza AJ, Rintalan CJ, Thompson HW, Downs JC, Hart RT, Burgoyne CF. Deformation of the lamina cribrosa and anterior scleral canal wall in early experimental glaucoma. Invest Ophthalmol Vis Sci. 2003; 44: 623–637 - PubMed
    1. Burgoyne CF, Varma R, Quigley HA, Vitale S, Pease ME, Lenane PL. Global and regional detection of induced optic disc change by digitized image analysis. Arch Ophthalmol. 1994; 112: 261–268 - PubMed

Publication types