. 2014 Feb;13(2):666-77.
doi: 10.1074/mcp.M112.025445. Epub 2013 Nov 19.

Statistical approach to protein quantification

Affiliations

Statistical approach to protein quantification

Sarah Gerster et al. Mol Cell Proteomics. 2014 Feb.

Abstract

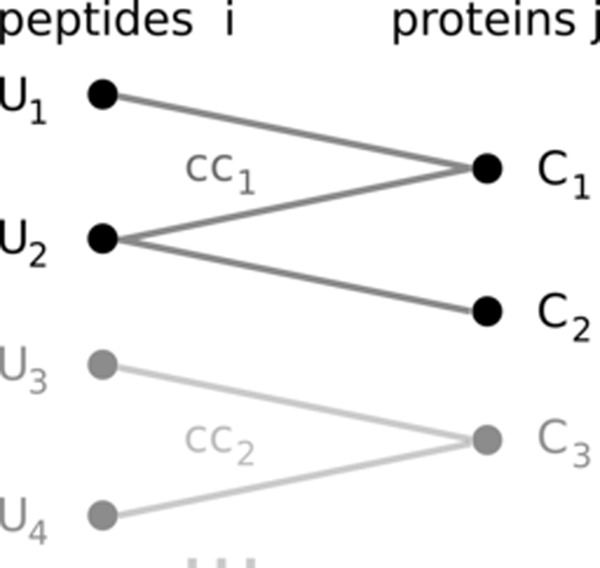
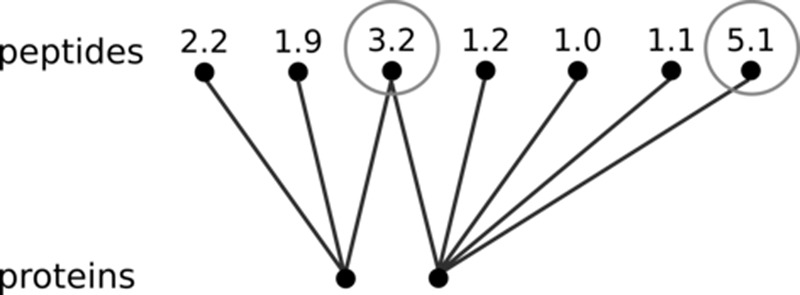
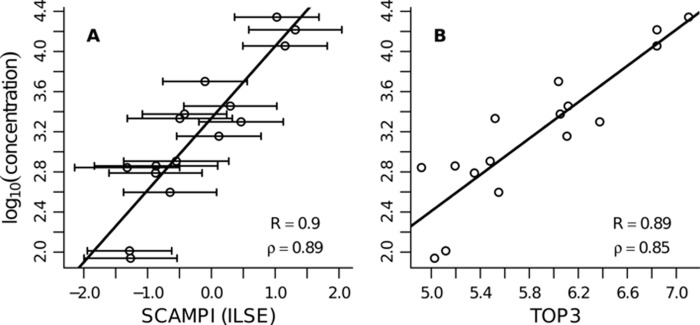
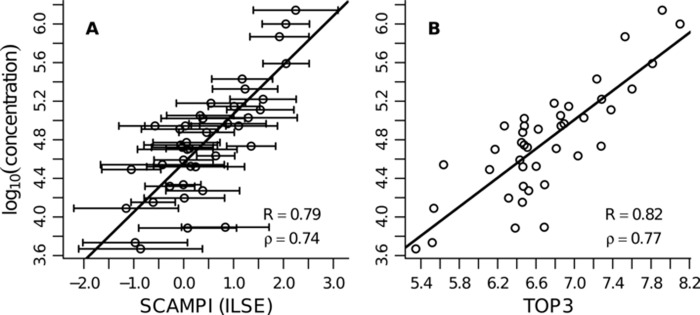
A major goal in proteomics is the comprehensive and accurate description of a proteome. This task includes not only the identification of proteins in a sample, but also the accurate quantification of their abundance. Although mass spectrometry typically provides information on peptide identity and abundance in a sample, it does not directly measure the concentration of the corresponding proteins. Specifically, most mass-spectrometry-based approaches (e.g. shotgun proteomics or selected reaction monitoring) allow one to quantify peptides using chromatographic peak intensities or spectral counting information. Ultimately, based on these measurements, one wants to infer the concentrations of the corresponding proteins. Inferring properties of the proteins based on experimental peptide evidence is often a complex problem because of the ambiguity of peptide assignments and different chemical properties of the peptides that affect the observed concentrations. We present SCAMPI, a novel generic and statistically sound framework for computing protein abundance scores based on quantified peptides. In contrast to most previous approaches, our model explicitly includes information from shared peptides to improve protein quantitation, especially in eukaryotes with many homologous sequences. The model accounts for uncertainty in the input data, leading to statistical prediction intervals for the protein scores. Furthermore, peptides with extreme abundances can be reassessed and classified as either regular data points or actual outliers. We used the proposed model with several datasets and compared its performance to that of other, previously used approaches for protein quantification in bottom-up mass spectrometry.


Figures

Fig. 1.
Fig. 1.
Bipartite graph with experimentally identified peptide (left-hand side) and matching protein sequences. There is an edge between a peptide and a protein if and only if the peptide sequence occurs exactly in the protein sequence. Each peptide i (i = 1, …, n) has a score Ui that is assumed to be proportional to its abundance. The aim of the model is to infer the concentration Cj for each protein in the graph (j = 1, …, m). The graph is composed of many subgraphs, or connected components, which are referred to as ccr (r = 1, …, R). Each connected component holds nr peptides and mr proteins.
Fig. 2.
Fig. 2.
Hypothetical example to illustrate the idea behind SCAMPI's peptide reassessment step. The given peptide scores could be any abundance measure (e.g. logarithmized peak intensities). At first glance, there seem to be discrepancies in the measurements for the circled peptides. However, considering the graph structure, only the peptide with a value of 5.1 cannot be explained and is thus a “real” outlier. Indeed, the value of 3.2 can be explained by a contribution from both proteins. An example of a real connected component is discussed in the supplemental material (“Directed MS Human Data”).
Fig. 3.
Fig. 3.
L. interrogans dataset—protein abundance estimates for the 16 anchor proteins. A, results for SCAMPI (using ILSE parameter estimates). The error bars correspond to the 95% prediction intervals. B, outcome for the TOP3 approach. The correlation coefficients in the two panels are very similar. Performance measures: R and ρ indicate the Pearson and Spearman's rank correlation coefficients, respectively. Note that the scale on the x-axis is different in the two panels. The range of the computed scores depends on the underlying model. We cannot compare the scores from SCAMPI and from TOP3 directly, but we can look at correlations with a reference score, as presented in this figure.
Fig. 4.
Fig. 4.
Directed MS human dataset—protein abundance estimates for the 42 anchor proteins. SCAMPI (ILSE parameter estimate) in A is compared with the TOP3 approach in B. The performance scores are similar in the two subfigures. The error bars in A correspond to the 95% prediction intervals. Performance measures: R and ρ indicate the Pearson and Spearman's rank correlation coefficients, respectively. Note that the scale on the x-axis is different in the two panels. The range of the computed scores depends on the underlying model. We cannot compare the scores from SCAMPI and from TOP3 directly, but we can look at correlations with a reference score, as presented in this figure.
Fig. 5.
Fig. 5.
Human SILAC dataset—protein abundance score distributions obtained with SCAMPI (ILSE parameter estimates) are shown for control (A) and treatment (B). The quantile-quantile plot in C compares the two distributions. The line is passing through the origin and has a 45° angle (x = y). The abundance score distributions for control and treatment are directly comparable, as they are very similar (e.g. comparable median and quartiles).
Fig. 6.
Fig. 6.
Human SILAC dataset—distribution of the difference between the protein abundance estimates in the treated and in the control case (Dj = ĈjtreatedĈjcontrol). A, distribution of the estimated abundance changes. B, scatter plot of the protein identification number versus the estimated abundance difference. The two panels show essentially the same information. Particularly high score differences are highlighted (gray ticks in A and gray asterisks in B).
Fig. 7.
Fig. 7.
Human SILAC dataset—peptide abundance score reassessment for the control case in the SILAC-labeled human shotgun proteomics data. Triangles indicate information from shared peptides, and squares that from unique sequences. The residual plot in A (estimated scores (Ûi) versus residuals (Ri = UiÛi)) does not show any major violations of the modeling assumptions. The normal quantile-quantile plot in B shows that the normality assumption on the errors is correct for the bulk of the data. Points marked by gray asterisks show the peptides that were selected as outliers.
Fig. 8.
Fig. 8.
Human SILAC dataset—SCAMPI accurately modeled highly abundant shared peptides. In this example from the SILAC-labeled human shotgun proteomics data, the larger circle represents the 304 (1% of all peptides) sequences with the greatest input abundance scores for the control condition. 60% of these peptides were unique, and 40% were shared. The smaller circle represents the subpopulation of these peptides that also belonged to the 1% of peptides with the highest residuals. Among this subpopulation (73 sequences), 82% were unique peptides, and only 18% were shared. This shows that SCAMPI can explain highly abundant shared peptides extremely well and thus affirm that these measurements are correct and should not be regarded as outliers.

References

    1. Gerber S. A., Rush J., Stemman O., Kirschner M. W., Gygi S. P. (2003) Absolute quantification of proteins and phosphoproteins from cell lysates by tandem MS. Proc. Natl. Acad. Sci. U.S.A. 100, 6940–6945 - PMC - PubMed
    1. Silva J. C., Gorenstein M. V., Li G. Z., Vissers J. P. C., Geromanos S. J. (2006) Absolute quantification of proteins by LCMSE: a virtue of parallel MS acquisition. Mol. Cell. Proteomics 5, 144–156 - PubMed
    1. Aebersold R., Mann M. (2003) Mass spectrometry-based proteomics. Nature 422, 198–207 - PubMed
    1. Wang F. (2008) Biomarker Methods in Drug Discovery and Development. Humana Press, Totowa, NJ
    1. Wysocki V. H., Resing K. A., Zhang Q., Cheng G. (2005) Mass spectrometry of peptides and proteins. Methods 35, 211–222 - PubMed

Publication types