

mTOR signaling in liver regeneration: Rapamycin combined with growth factor treatment
- PMID: 24255881
- PMCID: PMC3832859
- DOI: 10.5500/wjt.v3.i3.36
mTOR signaling in liver regeneration: Rapamycin combined with growth factor treatment
Abstract
Aim: To investigate the effects of mammalian target of rapamycin (mTOR) inhibition on liver regeneration and autophagy in a surgical resection model.
Methods: C57BL/6 mice were subjected to a 70% partial hepatectomy (PH) and treated intraperitoneally every 24 h with a combination of the mTOR inhibitor rapamycin (2.5 mg/kg per day) and the steroid dexamethasone (2.0 mg/kg per day) in phosphate buffered saline (PBS) or with PBS alone as vehicle control. In the immunosuppressant group, part of the group was treated subcutaneously 4 h prior to and 24 h after PH with a combination of human recombinant interleukin 6 (IL-6; 500 μg/kg per day) and hepatocyte growth factor (HGF; 100 μg/kg per day) in PBS. Animals were sacrificed 2, 3 or 5 d after PH and liver tissue and blood were collected for further analysis. Immunohistochemical staining for 5-Bromo-2'-deoxyuridine (BrdU) was used to quantify hepatocyte proliferation. Western blotting was used to detect hepatic microtubule-associated protein 1 light chain 3 (LC3)-II protein expression as a marker for autophagy. Hepatic gene expression levels of proliferation-, inflammation- and angiogenesis-related genes were examined by real-time reverse transcription-polymerase chain reaction and serum bilirubin and transaminase levels were analyzed at the clinical chemical core facility of the Erasmus MC-University Medical Center.
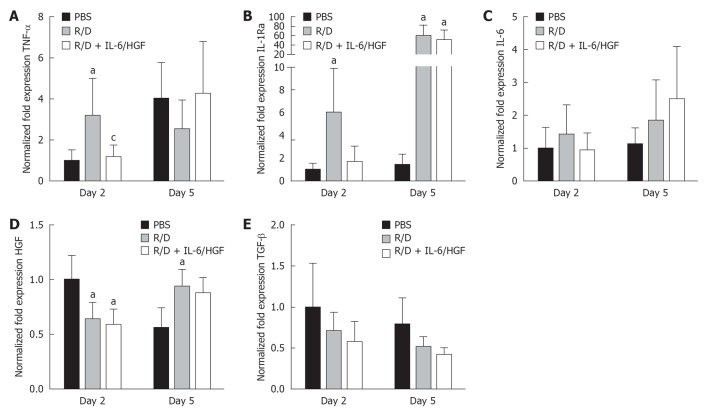
Results: mTOR inhibition significantly suppressed regeneration, shown by decreased hepatocyte proliferation (2% vs 12% BrdU positive hepatocyte nuclei at day 2, P < 0.01; 0.8% vs 1.4% at day 5, P = 0.02) and liver weight reconstitution (63% vs 76% of initial total liver weight at day 3, P = 0.04), and furthermore increased serum transaminase levels (aspartate aminotransferase 641 U/L vs 185 U/L at day 2, P = 0.02). Expression of the autophagy marker LC3-II, which was reduced during normal liver regeneration, increased after mTOR inhibition (46% increase at day 2, P = 0.04). Hepatic gene expression showed an increased inflammation-related response [tumor necrosis factor (TNF)-α 3.2-fold upregulation at day 2, P = 0.03; IL-1Ra 6.0-fold upregulation at day 2 and 42.3-fold upregulation at day 5, P < 0.01] and a reduced expression of cell cycle progression and angiogenesis-related factors (HGF 40% reduction at day 2; vascular endothelial growth factor receptor 2 50% reduction at days 2 and 5; angiopoietin 1 60% reduction at day 2, all P ≤ 0.01). Treatment with the regeneration stimulating cytokine IL-6 and growth factor HGF could overcome the inhibitory effect on liver weight (75% of initial total liver weight at day 3, P = 0.02 vs immunosuppression alone and P = 0.90 vs controls) and partially reversed gene expression changes caused by rapamycin (TNF-α and IL-1Ra levels at day 2 were restored to control levels). However, no significant changes in hepatocyte proliferation, serum injury markers or autophagy were found.
Conclusion: mTOR inhibition severely impairs liver regeneration and increases autophagy after PH. These effects are partly reversed by stimulation of the IL-6 and HGF pathways.
Keywords: Autophagy; Hepatocyte proliferation; Microtubule-associated protein 1 light chain 3; Partial hepatectomy; Rapamycin.
Figures


References
-
- Wu C, Wang P, Rao J, Wang Z, Zhang C, Lu L, Zhang F. Triptolide alleviates hepatic ischemia/reperfusion injury by attenuating oxidative stress and inhibiting NF-κB activity in mice. J Surg Res. 2011;166:e205–e213. - PubMed
-
- Selzner N, Rudiger H, Graf R, Clavien PA. Protective strategies against ischemic injury of the liver. Gastroenterology. 2003;125:917–936. - PubMed
-
- Cressman DE, Greenbaum LE, DeAngelis RA, Ciliberto G, Furth EE, Poli V, Taub R. Liver failure and defective hepatocyte regeneration in interleukin-6-deficient mice. Science. 1996;274:1379–1383. - PubMed
-
- Cressman DE, Diamond RH, Taub R. Rapid activation of the Stat3 transcription complex in liver regeneration. Hepatology. 1995;21:1443–1449. - PubMed
LinkOut - more resources
Full Text Sources
Other Literature Sources
Research Materials
Miscellaneous
