. 2014 Jan 23;123(4):541-53.
doi: 10.1182/blood-2013-05-500272. Epub 2013 Nov 19.

Loss of Asxl1 leads to myelodysplastic syndrome-like disease in mice

Affiliations

Loss of Asxl1 leads to myelodysplastic syndrome-like disease in mice

Jiapeng Wang et al. Blood. .

Abstract

ASXL1 is mutated/deleted with high frequencies in multiple forms of myeloid malignancies, and its alterations are associated with poor prognosis. De novo ASXL1 mutations cause Bohring-Opitz syndrome characterized by multiple congenital malformations. We show that Asxl1 deletion in mice led to developmental abnormalities including dwarfism, anophthalmia, and 80% embryonic lethality. Surviving Asxl1(-/-) mice lived for up to 42 days and developed features of myelodysplastic syndrome (MDS), including dysplastic neutrophils and multiple lineage cytopenia. Asxl1(-/-) mice had a reduced hematopoietic stem cell (HSC) pool, and Asxl1(-/-) HSCs exhibited decreased hematopoietic repopulating capacity, with skewed cell differentiation favoring granulocytic lineage. Asxl1(+/-) mice also developed mild MDS-like disease, which could progress to MDS/myeloproliferative neoplasm, demonstrating a haploinsufficient effect of Asxl1 in the pathogenesis of myeloid malignancies. Asxl1 loss led to an increased apoptosis and mitosis in Lineage(-)c-Kit(+) (Lin(-)c-Kit(+)) cells, consistent with human MDS. Furthermore, Asxl1(-/-) Lin(-)c-Kit(+) cells exhibited decreased global levels of H3K27me3 and H3K4me3 and altered expression of genes regulating apoptosis (Bcl2, Bcl2l12, Bcl2l13). Collectively, we report a novel ASXL1 murine model that recapitulates human myeloid malignancies, implying that Asxl1 functions as a tumor suppressor to maintain hematopoietic cell homeostasis. Future work is necessary to clarify the contribution of microenvironment to the hematopoietic phenotypes observed in the constitutional Asxl1(-/-) mice.


Figures
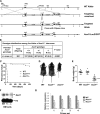
Figure 1
Figure 1
Generation of Asxl1:nlacZ/nGFP knock-in mice. (A) An nlacZ/nGFP-FRTNeoFRT cassette was introduced 6 bp upstream of the Asxl1 start codon. Rectangular black bars indicate exons. S, StuI. (B) Genotype distribution among live births of Asxl1+/− intercross. Asxl1−/− mice are underrepresented. P values are compared with normal Mendelian distribution (25%, 50%, 25%) using a χ2 test. (C) Kaplan-Meier curve representing the percent survival of Asxl1−/− (n = 12), Asxl1+/− (n = 42), and WT (n = 42) mice vs age in days. (D) The gross appearance of an Asxl1−/− mouse compared with WT and Asxl1+/− littermates (4 weeks old). (E) Body weight of WT, Asxl1+/−, and Asxl1−/− mice (3-6 weeks old, 9 mice/genotype; ***P < .001). (F) Western blot shows the reduced and deletion of Asxl1 expression in BM cells of representative Asxl1+/− and Asxl1−/− mice, respectively, compared with WT. (G) Analyses of Asxl1 mRNA expression levels in BM cells of WT (n = 4), Asxl1+/− (n = 5), and Asxl1−/− (n = 5) mice by qPCR with 4 different pairs of primers. The relative Asxl1 mRNA expression was determined by using β-actin as an internal calibrator and reported as relative expression units to the respective Asxl1 expression with each primer pair in WT mice. **P < .01, ***P < .001
Figure 2
Figure 2
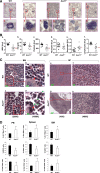
Loss of Asxl1 leads to MDS-like disease. (A) May-Giemsa–stained PB smears prepared from representative WT (a-b) and Asxl1−/− (c-k) mice are shown. The PB smear of Asxl1−/− mice showed dysplastic features including hypersegmented neutrophils (c-d), bilobed and hyposegmented neutrophils (e-f) consistent with pseudo–Pelger-Huët anomaly, as well as an increased number of polychromatophilic RBCs (h-i), and Howell-Jolly body in erythrocytes (e,g). The PB smear of representative Asxl1−/− mice showed monocytosis (j-k). (B) Parameters of PB were summarized from WT (n = 9) and Asxl1−/− (n = 9) mice of 3 to 6 weeks of age: WBC counts (a), Hb (b), platelets (c), neutrophils (d), monocytes (e), and lymphocytes (f). *P < .05, **P < .01. (C) Hematoxylin and eosin staining of paraffin-embedded sections of femurs (a-d) and spleen (e-h) from representative WT and Asxl1−/− mice (4 weeks old). BM: original magnification ×20 in (a) and (c), and original magnification ×100 in (b) and (d). Red arrows indicate megakaryocytes, and green arrows indicate myeloid cells. SP: original magnification ×4 in (e) and (g), and original magnification ×40 in (g) and (h). (D) Quantitation of the Gr1+/Mac1+, B220+, and CD4+/CD8+ cell populations. Percentage in PB, spleen, and BM cells of WT and Asxl1−/− mice (3-5 weeks old). Data are presented as mean ± SD from 4 sets of WT and Asxl1−/− littermates. *P < .05.
Figure 3
Figure 3
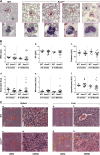
Haploinsufficiency of Asxl1 is sufficient for the development of MDS-like disease and MDS/MPN in mice. (A) May-Giemsa–stained PB smears prepared from representative adult WT (a-b) and Asxl1+/− (c-j) mice (6-12 months old) are shown. The PB smear of Asxl1+/− mice showed dysplastic features including bilobed and hyposegmented neutrophils with clumping chromatin consistent with pseudo–Pelger-Huët anomaly (c-d), hypersegmented neutrophils (e-f), and apoptotic neutrophils (g-h). The PB smear of representative Asxl1+/− mice showed monocytosis (i-j). (B) Parameters of PB were summarized from young WT (n = 7) and Asxl1+/− (3-6 weeks old, n = 10) and aged WT (n = 7) and adult Asxl1+/− (6-12 months old, n = 18) mice: WBC counts (a), Hb (b), platelets (c), neutrophils (d), monocytes (e), and lymphocytes (f). (C-D) Hematoxylin and eosin staining of paraffin-embedded sections of spleen (C, right), liver (C, left), and femurs (D), from representative aged WT and Asxl1+/− mice. Yellow lines represent areas containing infiltrating myeloid cells (Cg-h). Blue arrows indicate dysplastic cells (Dd). Spleen and liver: original magnification ×4 in (a), (c), (e), and (g); and original magnification ×40 in (b), (d), (f), and (h). BM: original magnification ×20 in (a) and (c), and original magnification ×100 in (b) and (d). (E) Quantitation of the percentage of Gr1+/Mac1+, B220+, and CD4+/CD8+ cell populations in PB, spleen, and BM of WT and Asxl1+/− mice (6-12 months old). Data are presented as mean ± SD from 5 sets of WT and Asxl1+/− littermates. *P < .05.
Figure 3
Figure 3
Haploinsufficiency of Asxl1 is sufficient for the development of MDS-like disease and MDS/MPN in mice. (A) May-Giemsa–stained PB smears prepared from representative adult WT (a-b) and Asxl1+/− (c-j) mice (6-12 months old) are shown. The PB smear of Asxl1+/− mice showed dysplastic features including bilobed and hyposegmented neutrophils with clumping chromatin consistent with pseudo–Pelger-Huët anomaly (c-d), hypersegmented neutrophils (e-f), and apoptotic neutrophils (g-h). The PB smear of representative Asxl1+/− mice showed monocytosis (i-j). (B) Parameters of PB were summarized from young WT (n = 7) and Asxl1+/− (3-6 weeks old, n = 10) and aged WT (n = 7) and adult Asxl1+/− (6-12 months old, n = 18) mice: WBC counts (a), Hb (b), platelets (c), neutrophils (d), monocytes (e), and lymphocytes (f). (C-D) Hematoxylin and eosin staining of paraffin-embedded sections of spleen (C, right), liver (C, left), and femurs (D), from representative aged WT and Asxl1+/− mice. Yellow lines represent areas containing infiltrating myeloid cells (Cg-h). Blue arrows indicate dysplastic cells (Dd). Spleen and liver: original magnification ×4 in (a), (c), (e), and (g); and original magnification ×40 in (b), (d), (f), and (h). BM: original magnification ×20 in (a) and (c), and original magnification ×100 in (b) and (d). (E) Quantitation of the percentage of Gr1+/Mac1+, B220+, and CD4+/CD8+ cell populations in PB, spleen, and BM of WT and Asxl1+/− mice (6-12 months old). Data are presented as mean ± SD from 5 sets of WT and Asxl1+/− littermates. *P < .05.
Figure 4
Figure 4
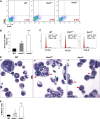
Asxl1 loss leads to increased apoptotic and mitotic cells in BM Linc-Kit+ cells. (A) Flow cytometric analysis of freshly isolated Linc-Kit+ cells from the BM of representative WT, Asxl1+/−, and Asxl1−/− littermates (5 weeks old) after Annexin V/7-AAD staining. (B) Quantitation of the subgroup of apoptotic cell population that is Annexin V+/7-AAD. Data are presented as mean ± SD from 3 sets of WT, Asxl1+/−, and Asxl1−/− mice (4-5 weeks old). (C) Cell cycle analysis of Linc-Kit+ cells from representative WT, Asxl1+/−, and Asxl1−/− littermates are shown (5 weeks old). Similar results were obtained using another set of Asxl1 littermates of mice (4 weeks old). (D-E) Representative images of May-Giemsa–stained cytospin preparations of cells from WT, Asxl1+/−, or Asxl1−/− BM cell–derived colonies showing an increased proportion of mitotic cells (red arrowheads, D). The quantitation of the percent of mitotic cells is shown by performing a 500-cell count of at least 10 colonies from each genotype (E). Representative data from 2 separate experiments are shown as mean ± SD. *P < .05, **P < .01.
Figure 5
Figure 5
Altered HSC and myeloid progenitor cell populations in Asxl1/ mice. (A) Flow cytometric analysis of LSK and LK compartments in the BM of representative young WT, Asxl1+/−, and Asxl1−/− mice (4 weeks old). (B-C) Quantitation of the percent of LSK (B) and LK (C) cells in the total BM cells of each genotype of mice (mean ± SD, 4-5 mice/genotype, 3-6 weeks old, *P < .05). (D) Flow cytometric analysis of CMP, GMP, and MEP populations in the BM LK cell population of WT, Asxl1+/−, and Asxl1−/− mice are shown. (E) Quantitative analysis of CMP, GMP, and MEP populations in the LK cell population (4-5 mice/group, 3-6 weeks old, *P < .05). (F) BM progenitor assay. CFU numbers were assessed in semisolid media in the presence of mSCF, mIL-3, IL-6, and EPO. Data are presented as mean ± SEM from 4 to 5 mice per genotype. Black bars represent CFU-GM (granulocytes/macrophages), open bars represent BFU-E (burst forming unit-erythrocyte), and gray bars represent CFU-Mix (mixed colonies of GM, E, and megakaryocytic cells). *P < .05.
Figure 6
Figure 6
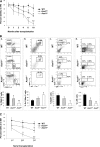
Asxl1 loss impaired the hematopoietic repopulation capacity of HSCs. CD45.2+ BM cells from young WT, Asxl1+/−, or Asxl1−/− mice were mixed with CD45.1+ competitor cells at a ratio of 1:1 (1 × 10⁶ cells each) and transplanted into lethally irradiated F1 recipients. (A) The kinetics of CD45.2 chimerism in the PB of mice receiving WT, Asxl1+/−, or Asxl1−/− BM cells are shown (mean ± SD of 3-7 animals). (B) Flow cytometric analysis of BM cells from representative mice receiving WT, Asxl1+/−, or Asxl1−/− BM cells 10 months after transplantation using indicated antibody combinations. The percent CD45.2+ cells as well as Gr1+/Mac1+, B220+, and LSK distribution within the CD45.2+ cells in the BM of each group of recipient mice is shown (mean ± SD of 3-5 animals). (C) Serial transplantations were performed as described in supplemental Material and methods. The percent CD45.2 chimerism in the BM of recipient mice 4 months after each round of transplantation is show as mean ± SEM. *P < .05, **P < .01.
Figure 7
Figure 7
Asxl1/ HSC/HPCs had an altered expression of genes implicated in apoptosis regulation and reduced global levels of H3K27me3 and H3K4me3. (A) The mRNA expression of HoxA5/7/9/10, Bcl2l13, Bcl2, and Bcl2l12 in the BM Linc-Kit+ cells of WT (n = 4) and Asxl1−/− (n = 4) mice were determined by qPCR. Data are shown as relative expression units to the respective gene expression in WT mice using Gapdh as an internal calibrator. (B) Western blot analyses of H3K27me3 and H3K4me3 in the BM Linc-Kit+ cells of each genotype of mice. Total H3 levels served as loading controls. Representative blots from 3 independent experiments are shown.

Similar articles

Cited by

References

    1. Fisher CL, Berger J, Randazzo F, Brock HW. A human homolog of Additional sex combs, ADDITIONAL SEX COMBS-LIKE 1, maps to chromosome 20q11. Gene. 2003;306:115–126. - PubMed
    1. LaJeunesse D, Shearn AE. E(z): a polycomb group gene or a trithorax group gene? Development. 1996;122(7):2189–2197. - PubMed
    1. Milne TA, Sinclair DA, Brock HW. The Additional sex combs gene of Drosophila is required for activation and repression of homeotic loci, and interacts specifically with Polycomb and super sex combs. Mol Gen Genet. 1999;261(4-5):753–761. - PubMed
    1. Lee SW, Cho YS, Na JM, et al. ASXL1 represses retinoic acid receptor-mediated transcription through associating with HP1 and LSD1. J Biol Chem. 2010;285(1):18–29. - PMC - PubMed
    1. Fisher CL, Randazzo F, Humphries RK, Brock HW. Characterization of Asxl1, a murine homolog of Additional sex combs, and analysis of the Asx-like gene family. Gene. 2006;369:109–118. - PubMed

Publication types

MeSH terms