. 2014 Jan;39(2):197-206.
doi: 10.1111/ejn.12402. Epub 2013 Oct 28.

Behavioural sensitivity to binaural spatial cues in ferrets: evidence for plasticity in the duplex theory of sound localization

Affiliations
Free PMC article

Behavioural sensitivity to binaural spatial cues in ferrets: evidence for plasticity in the duplex theory of sound localization

Peter Keating et al. Eur J Neurosci. 2014 Jan.
Free PMC article

Abstract

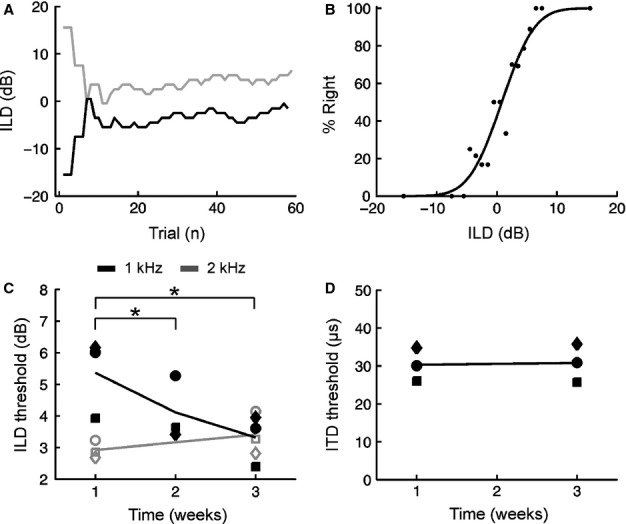
For over a century, the duplex theory has guided our understanding of human sound localization in the horizontal plane. According to this theory, the auditory system uses interaural time differences (ITDs) and interaural level differences (ILDs) to localize low-frequency and high-frequency sounds, respectively. Whilst this theory successfully accounts for the localization of tones by humans, some species show very different behaviour. Ferrets are widely used for studying both clinical and fundamental aspects of spatial hearing, but it is not known whether the duplex theory applies to this species or, if so, to what extent the frequency range over which each binaural cue is used depends on acoustical or neurophysiological factors. To address these issues, we trained ferrets to lateralize tones presented over earphones and found that the frequency dependence of ITD and ILD sensitivity broadly paralleled that observed in humans. Compared with humans, however, the transition between ITD and ILD sensitivity was shifted toward higher frequencies. We found that the frequency dependence of ITD sensitivity in ferrets can partially be accounted for by acoustical factors, although neurophysiological mechanisms are also likely to be involved. Moreover, we show that binaural cue sensitivity can be shaped by experience, as training ferrets on a 1-kHz ILD task resulted in significant improvements in thresholds that were specific to the trained cue and frequency. Our results provide new insights into the factors limiting the use of different sound localization cues and highlight the importance of sensory experience in shaping the underlying neural mechanisms.

Keywords: auditory localization; interaural level difference; interaural time difference; phase ambiguity; spatial hearing; training.


Figures

Fig. 1
Fig. 1
Schematic showing experimental apparatus used for behavioural testing. Free-field stimuli were presented from the two loudspeakers during initial training, prior to presenting stimuli via a closed-field sound delivery system comprising earphones positioned in head-mounted holders.
Fig. 2
Fig. 2
Effect of sound frequency on sensitivity to interaural time differences (ITDs). (A) Psychometric function for an individual session using 1-kHz tones showing the percentage of trials on which a subject responded to the right as a function of ITD. Black markers indicate raw data, with the results of a probit fit shown by a solid black line. Threshold (Δ) is defined as the difference between ITD values that are associated with responses to the right on 50 and 75% of trials. Dotted black lines illustrate the derivation of these values using the probit fit. (B) ITD thresholds are plotted for pure tones of different frequency. Filled grey markers show thresholds for individual subjects, with the mean across subjects indicated in black. Data were obtained at 1 kHz prior to measuring ITD sensitivity at low frequencies (offset slightly to the left) and again prior to determining the upper frequency limit of ITD sensitivity (offset slightly to the right). At lower frequencies, grey lines show the best fit to the averaged data under the assumption of fixed sensitivity to either ITDs (dotted) or IPDs (solid). Open symbols (at 3 and 4 kHz) indicate that thresholds could not be obtained. Asterisks denote significant differences (P < 0.05, corrected for multiple comparisons).
Fig. 3
Fig. 3
Phase ambiguity is produced by an interaction between ITD magnitude and sound frequency. (A) Phase ambiguity occurs because it is unclear whether the waveform in the right ear (grey) is delayed (ΔΦ1) or advanced (ΔΦ2) with respect to the waveform in the left ear (black). Assuming that the waveform is delayed in the right ear, it is also difficult to distinguish between a particular IPD (ΔΦ1) and other IPDs that differ either by a full period of the waveform (ΔΦ1 + 2π) or multiples thereof (i.e. ΔΦ1 + n2π). Spatial ambiguity can therefore occur whenever the IPD is consistent with more than one ITD in the physiological range. (B, C) For each combination of sound frequency and ITD, we determined the number of physiologically plausible ITDs corresponding to a single IPD (i.e. we measured the degree of spatial ambiguity). Where this value is equal to one (white region), this means that a particular combination of sound frequency and ITD is unambiguous. Values > 1 (grey) denote combinations of frequency and ITD that produce spatial ambiguity, with higher values (darker shades) indicating greater ambiguity with respect to the actual ITD. The black dotted lines depict the boundary between spatially unambiguous (below the line) and ambiguous (above the line) frequency–ITD combinations. The larger physiological ITD range experienced by humans (B) is expected to produce spatial ambiguity at lower frequencies than in ferrets (C), which have much smaller heads and therefore experience a much smaller ITD range. The curve of the dotted lines also indicates that, as frequency is increased, spatial ambiguity should initially occur for large ITDs produced by peripherally located sound sources, and then spread to more central locations (close to 0) as the sound frequency is increased further. (D) The maximum spatially unambiguous ITD is plotted for species of differing head size as a function of sound frequency. Pure tones with a frequency of 2 kHz are spatially ambiguous for humans, but not ferrets. Data are also shown for macaque monkeys (based on Spezio et al., ; Scott et al., 2009), where 2-kHz tones are spatially unambiguous only for ITDs < ∼ 100 μs, corresponding to locations close to the midline.
Fig. 4
Fig. 4
Effect of sound frequency on interaural level difference (ILD) sensitivity. (A) Psychometric function for an individual session using 3-kHz tones showing the percentage of trials on which the animal responded to the right as a function of ILD. (B) ILD thresholds plotted as a function of frequency. Grey markers show data for individual animals, with the black line showing mean thresholds across subjects. Asterisks denote significant differences (P < 0.05, corrected for multiple comparisons).
Fig. 5
Fig. 5
Effect of prolonged training on ILD thresholds using 1-kHz tones. (A) Data obtained from an individual session using an adaptive staircase procedure. Two staircases were randomly interleaved and used to target different points on the psychometric function (29% right, black; 71% right, grey). The ILD values for each staircase are plotted as a function of trial number. (B) Data from A but re-plotted as a psychometric function so that the percentage of trials on which a subject responded to the right is shown as a function of ILD (black markers). Best fit line obtained using probit analysis is shown in black, with thresholds calculated as before. (C) ILD thresholds are plotted as a function of the length of training received. Filled black markers show ILD thresholds obtained from individual subjects using 1-kHz tones, with the corresponding mean across subjects shown by the black line. Unfilled grey markers show 2-kHz ILD thresholds obtained from the same subjects during the first and last weeks of training with 1-kHz tones. (D) ITD thresholds obtained using 1-kHz tones from the same subjects during the first and last weeks of ILD training. Plotting conventions are identical to C. Asterisks denote significant differences (P < 0.05, corrected for multiple comparisons).

Similar articles

Cited by

References

    1. Algazi VR, Duda RO, Thompson DM, Avendano C. New Paltz, NY: Mohonk Mountain House; 2001. pp. 99–102. The CIPIC HRTF Database In: Proceedings of the 2001 IEEE Worskhop on Applications of Signal Processing to Audio and Acoustics.
    1. Bizley JK, Nodal FR, Parsons CH, King AJ. Role of auditory cortex in sound localization in the midsagittal plane. J. Neurophysiol. 2007;98:1763–1774. - PMC - PubMed
    1. Blauert J. Spatial Hearing: The Psychophysics of Human Sound Localization. Cambridge, MA: MIT Press; 1997.
    1. Brown CH, Beecher MD, Moody DB, Stebbins WC. Localization of pure tones by old world monkeys. J. Acoust. Soc. Am. 1978;63:1484–1492. - PubMed
    1. Brughera A, Dunai L, Hartmann WM. Human interaural time difference thresholds for sine tones: the high-frequency limit. J. Acoust. Soc. Am. 2013;133:2839–2855. - PMC - PubMed

Publication types

LinkOut - more resources