Review
. 2013 Dec;41(6):1343-54.
doi: 10.1042/BST20130232.

Seeing the invisible by paramagnetic and diamagnetic NMR

Affiliations
Review

Seeing the invisible by paramagnetic and diamagnetic NMR

G Marius Clore. Biochem Soc Trans. 2013 Dec.

Abstract

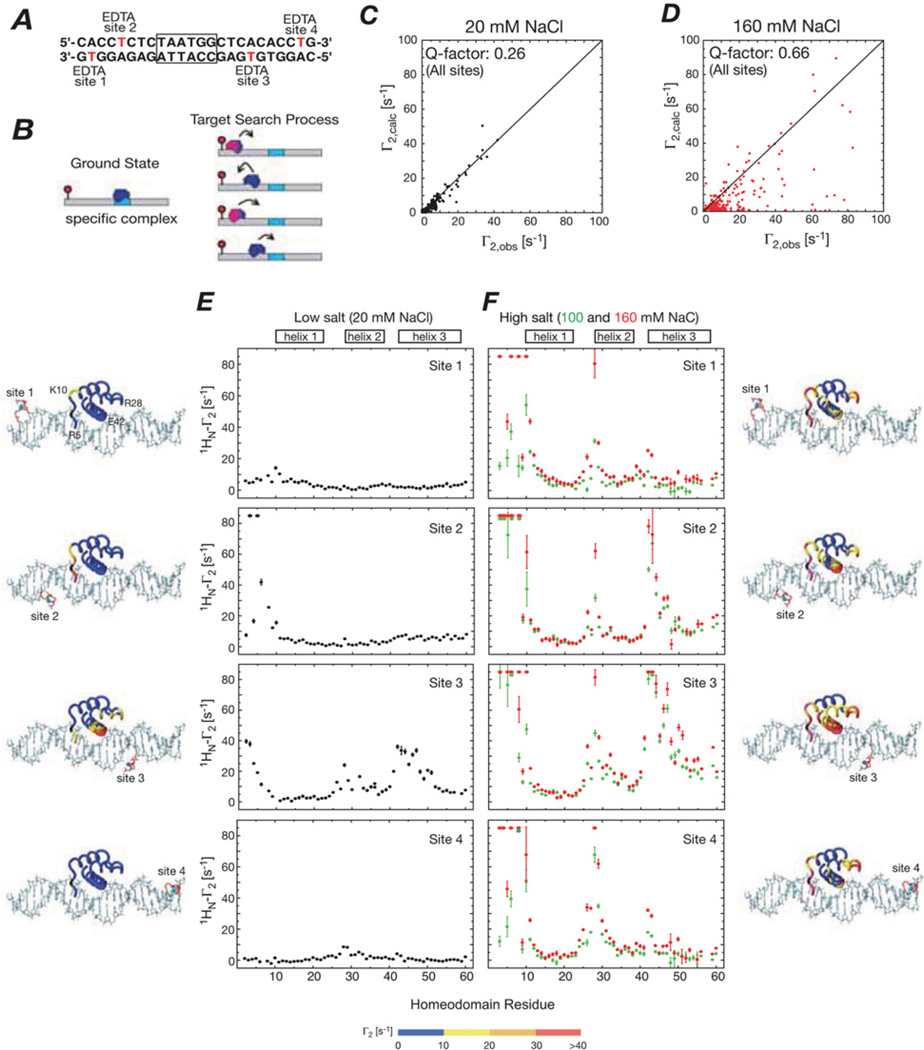
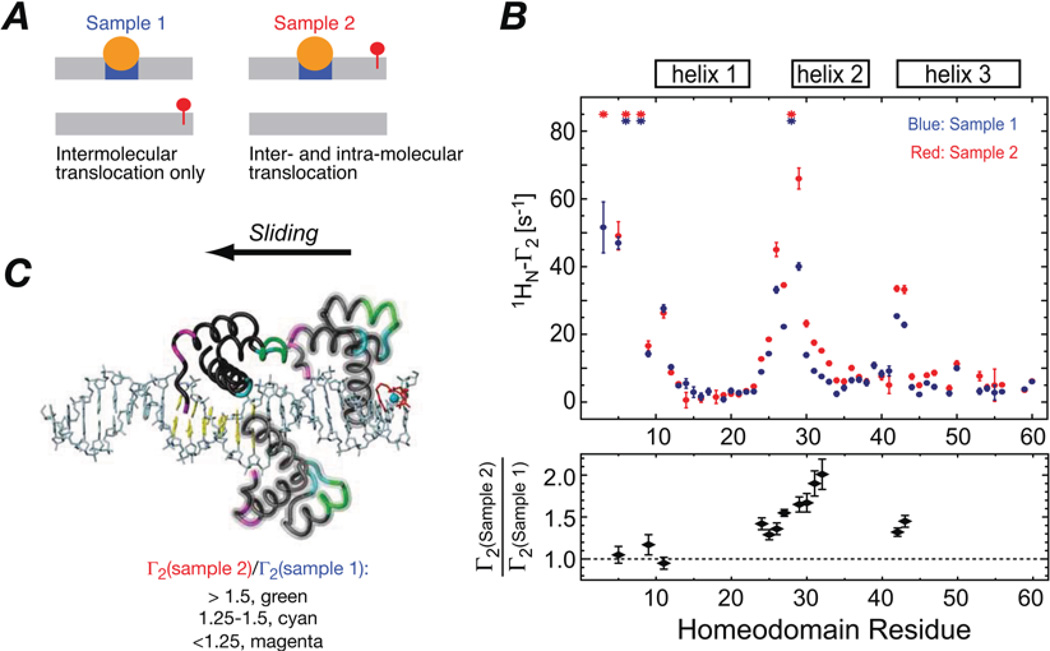
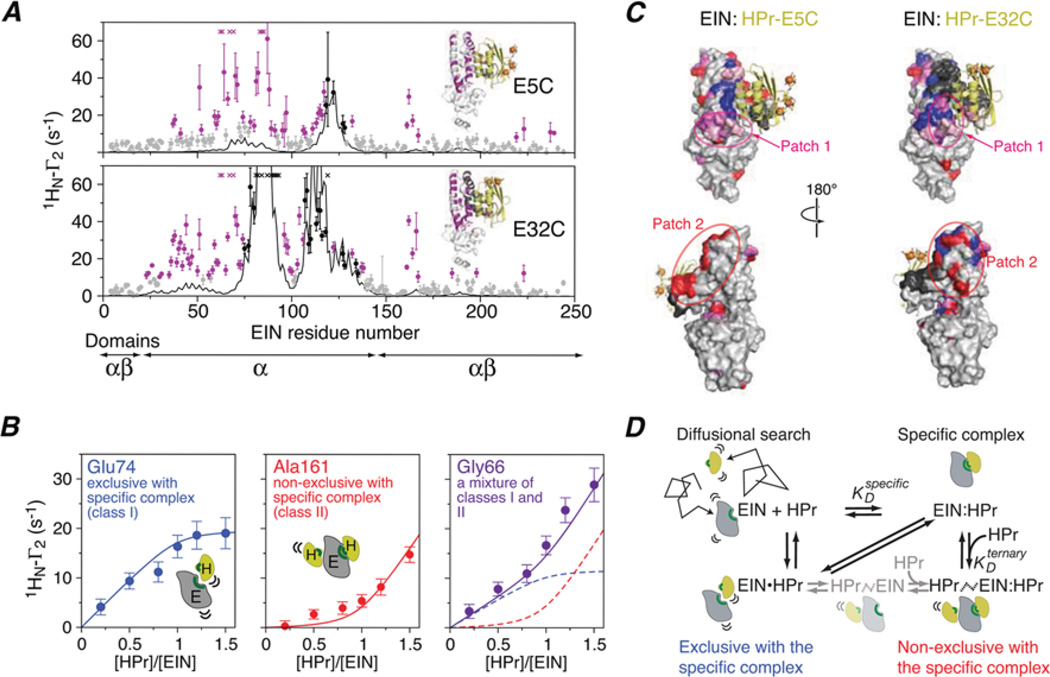
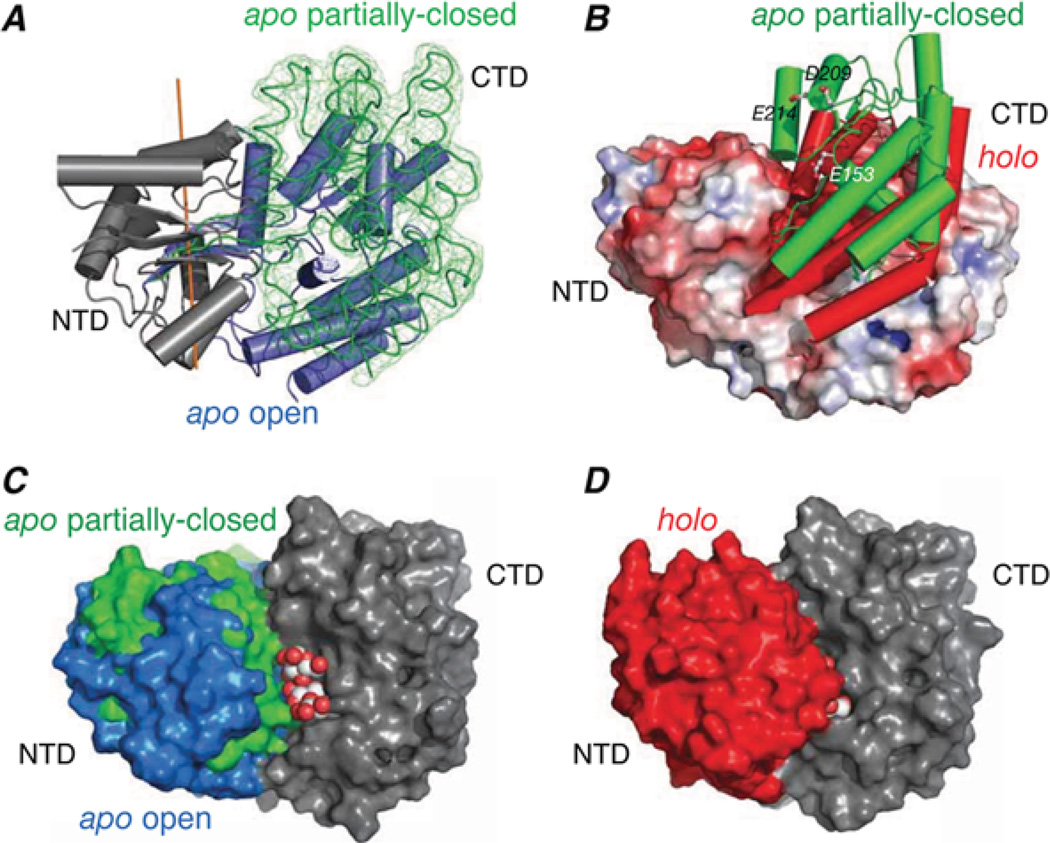
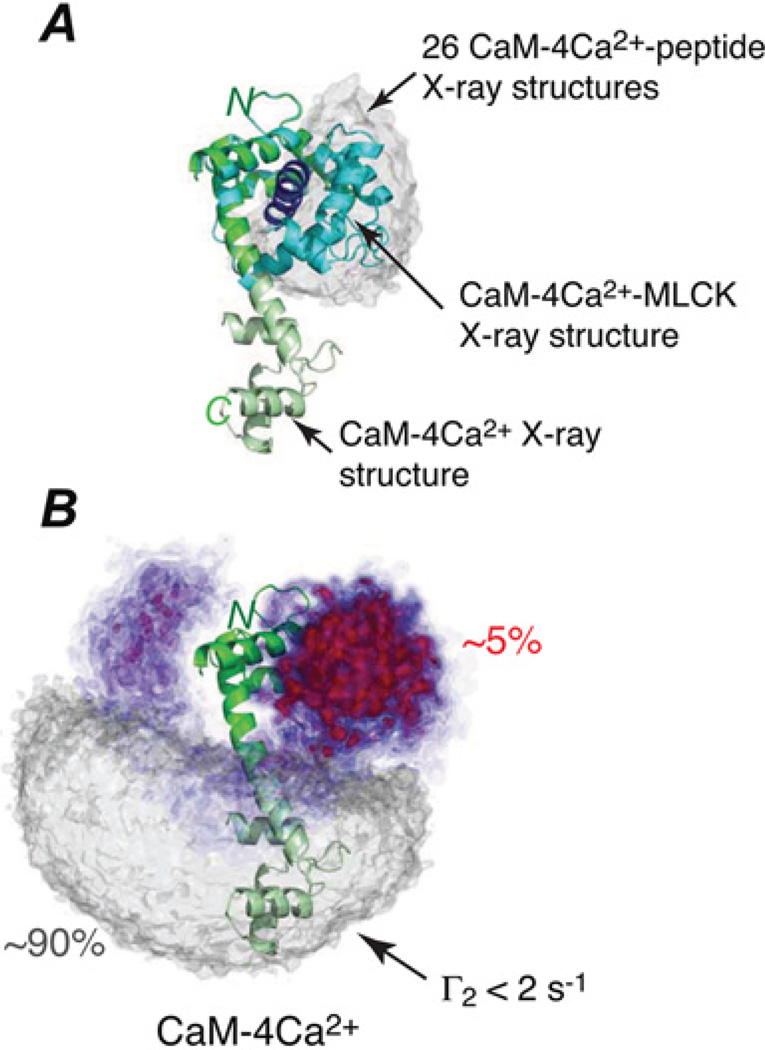
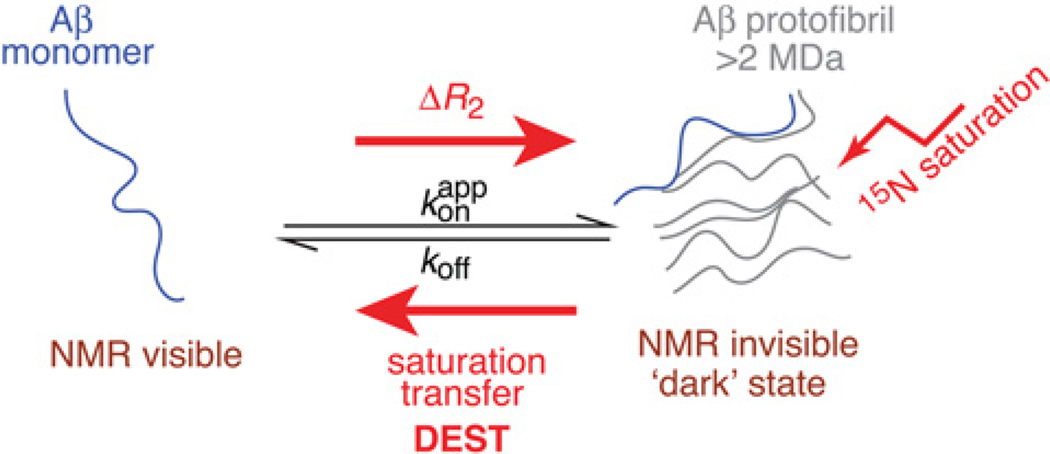
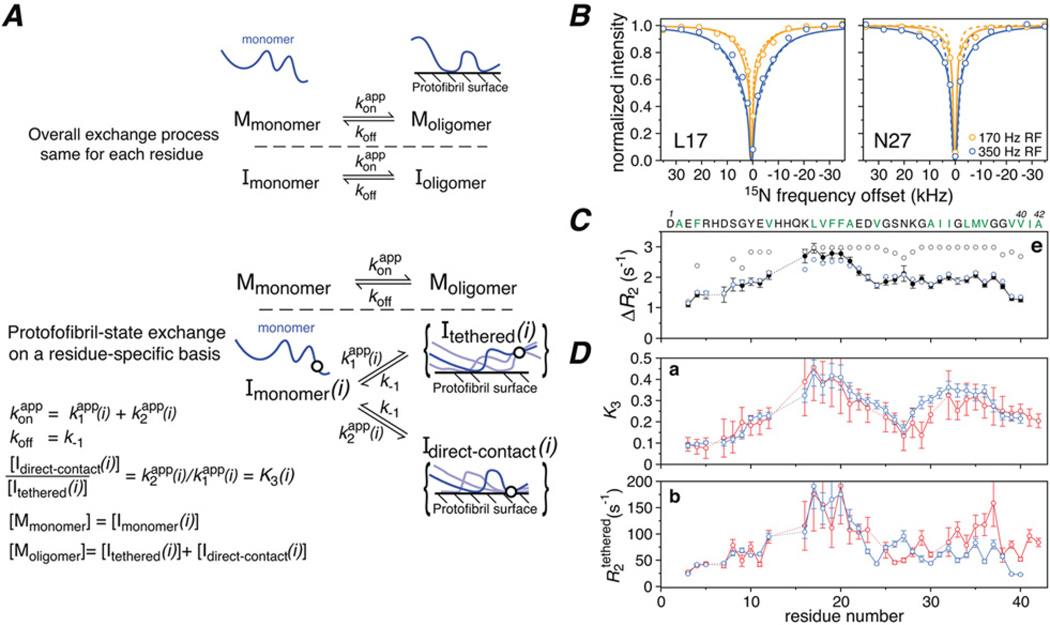
Sparsely populated transient states of proteins and their complexes play an important role in many biological processes including protein-protein and protein-DNA recognition, allostery, conformational selection, induced fit and self-assembly. These states are difficult to study as their low population and transient nature makes them effectively invisible to conventional structural and biophysical techniques. In the present article, I summarize recent NMR developments in our laboratory, including the use of paramagnetic relaxation enhancement, lifetime line broadening and dark-state exchange saturation transfer spectroscopy, that have permitted such sparsely populated states to be detected, characterized and, in some instances, visualized. I illustrate the application of these methods to the elucidation of mechanisms whereby transcription factors locate their specific target sites within an overwhelming sea of non-specific DNA, to the characterization of encounter complexes in protein-protein recognition, to large-scale interdomain motions involved in ligand binding, and to the interaction of monomeric amyloid β-peptide with the surface of amyloid protofibrils and the internal cavity surface of the chaperonin GroEL.


Figures

Figure 1
Figure 1. Intermolecular PREs observed for the specific HoxD9-DNA complex in low and high salt corresponding to slow and fast exchange regimes on the PRE relaxation time scale respectively for the interconversion between the specific complex and sparsely populated (<1 %) non-specific complexes
(A) A 24-bp DNA duplex with the specific site centrally located (boxed) and the location of the four paramagnetic labels (one at a time) indicated. (B) Diagrammatic representation of the specific complex (left) and the target search process whereby the specific complex is located (right). (C and D) Correlation between observed and calculated PREs for all four sites at low (20 mM) and high (160 mM) NaCl concentrations respectively. The calculated Γ2 values are obtained from a model [2] derived from the crystal structure of the Antennapedia homeodomain/DNA complex [40]. (E and F) Intermolecular PRE profiles observed at low (20 mM) and high (100 and 160 mM) NaCl respectively. The PRE data are mapped on the structural model of the specific complex, with the colour-coding depicting the observed PRE values. Adapted from Iwahara, J. and Clore, G.M. (2006) Detecting transient intermediates in macromolecular binding by paramagnetic NMR. Nature 440, 1227–1230 with permission.
Figure 2
Figure 2. Assessing the contributions of intramolecular sliding and intermolecular translocation for the HoxD9-DNA complex
(A) PRE data were collected on two samples containing an equimolar concentration of specific and non-specific DNA duplexes with the paramagnetic label attached to the end of the non-specific duplex in sample 1 and to the end of the specific duplex in sample 2. The location of the specific site and the paramagnetic label are indicated in blue and red respectively. (B) PRE profiles observed for samples 1 (blue) and 2 (red) are shown in the upper panel, and the ratio of the observed PRE rates for the two samples is shown in the lower panel. (C) Schematic representation of sliding along the DNA starting from the specific site with HoxD9 coloured according to the Γ2 (sample 2)/Γ2(sample 1) ratio. Adapted from Iwahara, J. and Clore, G.M. (2006) Detecting transient intermediates in macromolecular binding by paramagnetic NMR. Nature 440, 1227–1230 with permission.
Figure 3
Figure 3. Characterization of transient sparsely populated encounter complexes for the interaction of EIN and HPr
(A) Comparison of experimental backbone amide intermolecular PREs (1HN2) (circles) observed on 15N-labelled EIN and arising from covalently attached paramagnetic tags (EDTA-Mn2+) located at two positions on HPr (E5C and E32C) with the PRE profiles calculated from the structure of the specific complex (black line). Black and purple circles indicate PREs attributable to the specific complex and to an ensemble of encounter complexes respectively. (B) Intermolecular PREs as a function of added paramagnetically labelled HPr(E5C) illustrating three types of titration behaviour. (C) Mapping of intermolecular PREs attributable to the specific complex (black) and to the encounter complexes (class I, blue; class II, red; mixture of classes I and II, purple; and encounter complex PREs that are too large to measure accurately, pink). (D) Equilibrium binding model for the EIN-HPr association pathway. Adapted from Fawzi, N.L., Doucleff, M., Suh, J.Y. and Clore, G.M. (2010) Mechanistic details of a protein-protein association pathway revealed by paramagnetic relaxation enhancement titration measurements. Proc. Natl. Acad. Sci. U.S.A. 107, 1379–1384 with permission.
Figure 4
Figure 4. Structure of sparsely populated partially closed apo state of MBP derived from PRE measurements
(A) Superimposition of the major open (blue cylinders [25]) and minor partially closed (green trace [28]) states of apo-MBP with the N-terminal domains (grey) of the two species superimposed. The reweighted atomic probability map for the backbone heavy atoms of the C-terminal domain in the partially closed state is displayed as a green mesh plotted at a threshold of 20 %. (B) Comparison of the C-terminal domain orientation in the partially closed form of apo-MBP (green cylinders) and holo-MBP (red cylinders [26]) with the apo open state shown as a molecular surface colour-coded according to electrostatic potential. (C) Molecular surface representation of the major open and minor partially closed states of apo-MBP best-fitted to the C-terminal domain (CTD; grey) with the N-terminal domain (NTD) displayed in blue and green respectively. A space-filling representation of maltotriose is modelled bound to the C-terminal domain. (E) Holo-MBP shown in the same view as in (C) with the N-terminal domain in red and the C-terminal domain in grey; the substrate is buried in holo-MBP and is barely visible. Adapted from Tang, C., Schwieters, C.D. and Clore, G.M. (2007) Open-to-closed transition in apo maltose-binding protein observed by paramagnetic NMR. Nature 449, 1078–1082 with permission.
Figure 5
Figure 5. Visualization of the minor closed-state ensemble of CaM–4Ca2+
(A) Crystal structure of the CaM–4Ca2+ –MLCK (myosin light chain kinase) complex (CaM, cyan; MLCK, blue [41]) overlaid on the CaM–4Ca2+ dumbbell crystal structure (green [42]), best-fitted to the N-terminal domain. An additional 26 peptide-bound crystal structures were overlaid in the same manner, and the grey atomic probability map represents their distributions for the C-terminal domain. (B) Atomic probability density maps showing the conformational space sampled by the minor species ensemble derived from PRE measurements with ensemble members best-fitted to the N-terminal domain. The minor-state atomic probability maps, calculated from 100 independent simulated annealing calculations (with an ensemble size of eight and a population of 10 %), are plotted at multiple contour levels ranging from 0.1 (transparent blue) to 0.5 (opaque red) of maximum. The grey atomic probability density maps, plotted at a single contour level of 0.1 of maximum, show the conformational space sampled by the major species ensemble (90 % occupancy), characterized by no interdomain contacts (i.e. interdomain PRE values restrained to values less than 2 s−1). The extended dumbbell structure is displayed as a ribbon diagram for reference. Approximately half of the minor species ensemble occupies a region of conformational space that is in the vicinity of and overlaps with that of the peptide-bound structures (red probability map contours. Adapted with permission from Anthis, N.J., Doucleff, M. and Clore, G.M. (2011) Transient, sparsely populated compact states of apo and calcium-loaded calmodulin probed by paramagnetic relaxation enhancement: interplay of conformational selection and induced fit. J. Am. Chem. Soc. 133, 18966–18974.
Figure 6
Figure 6. Schematic illustration of lifetime line broadening (Δ/R2) and DEST effects for the exchange of Aβ monomer on the surface of large (>2 MDa) amyloid protofibrils
Adapted from Fawzi, N.L., Ying, J., Ghirlando, R., Torchia, D.A. and Clore, G.M. (2011) Atomic-resolution dynamics on the surface of amyloid-β protofibrils probed by solution NMR. Nature 480, 268–272 with permission.
Figure 7
Figure 7. Exchange of Aβ monomer on the surface of large polydisperse protofibrils studied by 15N lifetime line broadening (Δ/R2) and 15N-DEST
(A) Kinetic schemes for Aβ monomer exchange on the surface of amyloid protofibrils in which the protofibril-bound peptide (Moligomer) exists in only a single state (top), or a large ensemble of states such that each residue can be either tethered or in direct contact with the surface of the oligomer with K3(i)=k2 (app) (i)/ki (app) (i) (bottom). The circle in the diagrammatic representation of the states represents a single residue that is either tethered or in direct contact and for which three possible chain configurations are shown. (B) 15N-DEST profiles for Leu17 and Asn27 at two radiofrequency (RF) fields (170 Hz, orange; 350 Hz, blue) with the experimental points shown as circles, and the best-fit curves obtained with the single state or ensemble of states models shown as dashed and continuous lines respectively. (C) Comparison of the experimental 15N-ΔR2 profile (black closed circles) with the calculated profiles obtained with the single state (grey open circles) and ensemble of states (blue open circles) models. (D) Profiles for the residue-specific partition coefficient K3 (given by the ratio of direct contact to tethered states; see A, bottom panel) and 15N-R2 values for the tethered states derived from the fits to the experimental ΔR2 and DEST data. Adapted from Fawzi, N.L., Ying, J., Ghirlando, R., Torchia, D.A. and Clore, G.M. (2011) Atomic-resolution dynamics on the surface of amyloid-^ protofibrils probed by solution NMR. Nature 480, 268–272 with permission.

References

    1. Miyashita O, Onuchic JN, Wolynes PG. Nonlinear elasticity, proteinquakes, and the energy landscapes of functional transitions in proteins. Proc. Natl. Acad. Sci. U.S.A. 2003;100:12570–12575. - PMC - PubMed
    1. Iwahara J, Clore GM. Detecting transient intermediates in macromolecular binding by paramagnetic NMR. Nature. 2006;440:1227–1230. - PubMed
    1. Clore GM, Iwahara J. Theory, practice, and applications of paramagnetic relaxation enhancement for the characterization of transient low-population states of biological macromolecules and their complexes. Chem. Rev. 2009;109:4108–4139. - PMC - PubMed
    1. Palmer AG, 3rd, Kroenke CD, Loria JP. Nuclear magnetic resonance methods for quantifying microsecond-to-millisecond motions in biological macromolecules. Methods Enzymol. 2001;339:204–238. - PubMed
    1. Loria JP, Berlow RB, Watt ED. Characterization of enzyme motions by solution NMR relaxation dispersion. Acc. Chem. Res. 2008;41:214–221. - PubMed

MeSH terms