. 2013 Nov 21;14(1):813.
doi: 10.1186/1471-2164-14-813.

Clustered regulatory elements at nucleosome-depleted regions punctuate a constant nucleosomal landscape in Schizosaccharomyces pombe

Affiliations

Clustered regulatory elements at nucleosome-depleted regions punctuate a constant nucleosomal landscape in Schizosaccharomyces pombe

Ignacio Soriano et al. BMC Genomics. .

Abstract

Background: Nucleosomes facilitate the packaging of the eukaryotic genome and modulate the access of regulators to DNA. A detailed description of the nucleosomal organization under different transcriptional programmes is essential to understand their contribution to genomic regulation.

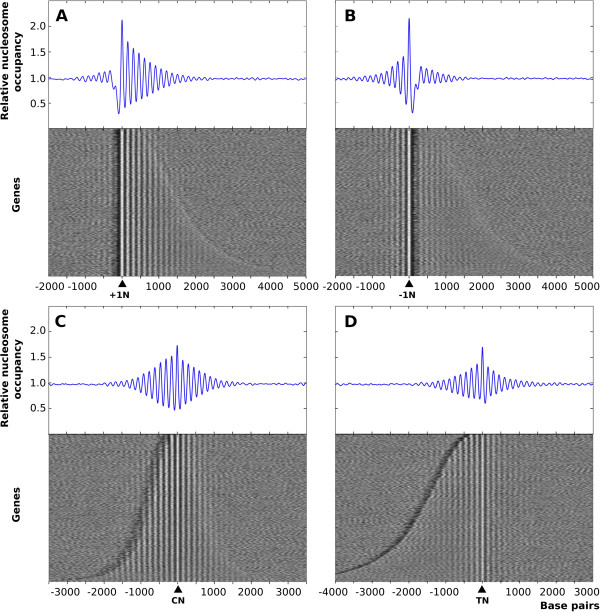
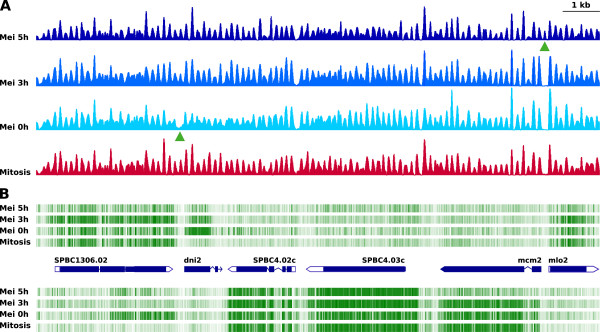
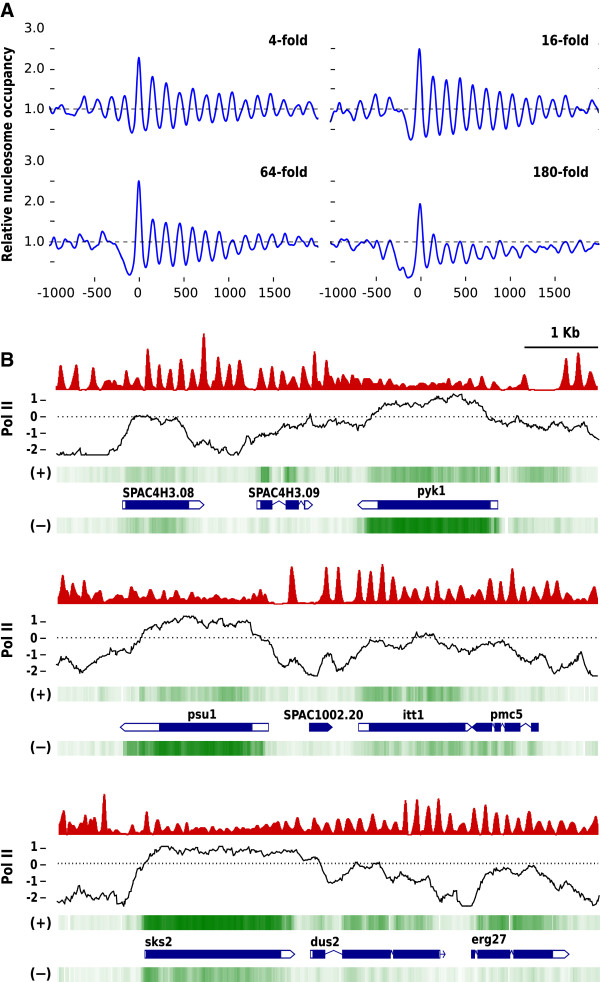
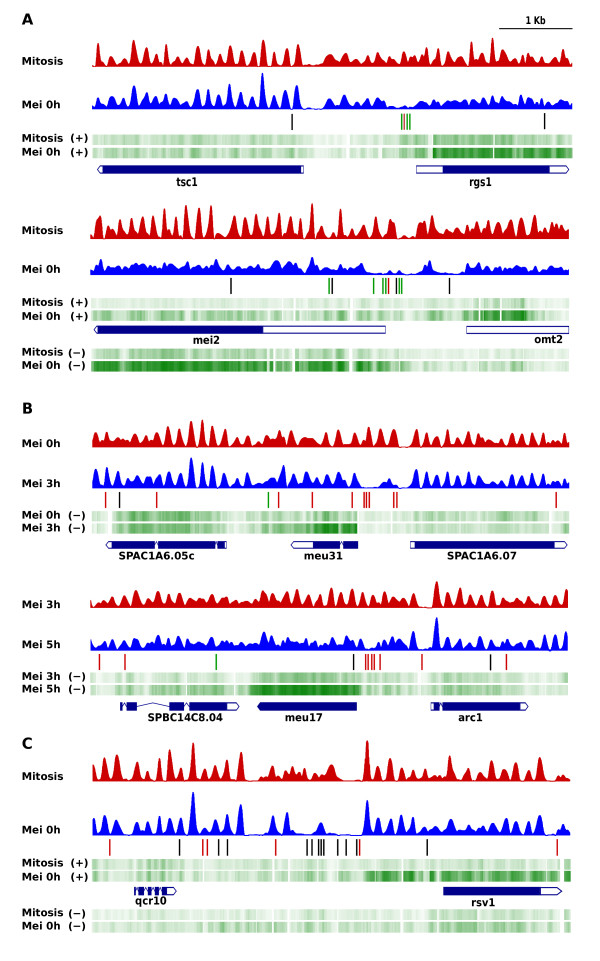
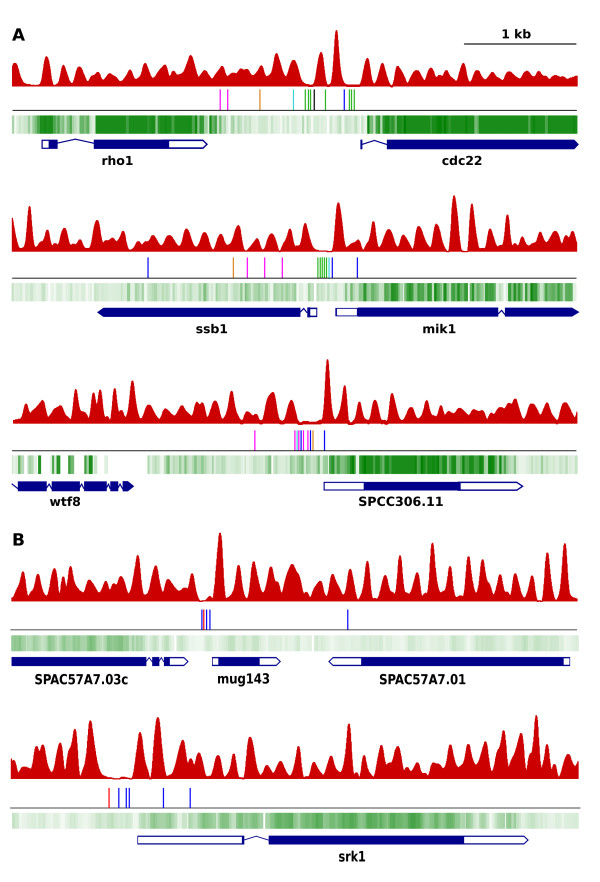
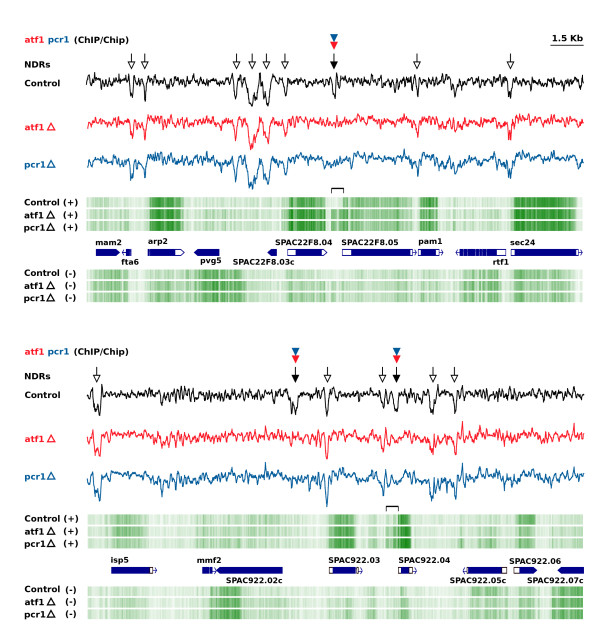
Results: To visualize the dynamics of individual nucleosomes under different transcriptional programmes we have generated high-resolution nucleosomal maps in Schizosaccharomyces pombe. We show that 98.5% of the genome remains almost invariable during mitosis and meiosis while remodelling is limited to approximately 1100 nucleosomes in the promoters of a subset of meiotic genes. These inducible nucleosome-depleted regions (NDR) and also those constitutively present in the genome overlap precisely with clusters of binding sites for transcription factors (TF) specific for meiosis and for different functional classes of genes, respectively. Deletion of two TFs affects only a small fraction of all the NDRs to which they bind in vivo, indicating that TFs collectively contribute to NDR maintenance.

Conclusions: Our results show that the nucleosomal profile in S. pombe is largely maintained under different physiological conditions and patterns of gene expression. This relatively constant landscape favours the concentration of regulators in constitutive and inducible NDRs. The combinatorial analysis of binding motifs in this discrete fraction of the genome will facilitate the definition of the transcriptional regulatory networks.


Figures

Figure 1
Figure 1
Nucleosome profile of transcribed and intergenic regions in S. pombe. The nucleosome profile of approximately 4000 S. pombe genes was aligned relative to the midpoint position of the +1 (+1 N) (A), -1 (−1 N) (B), central (CN) (C) and terminal (TN) (D) nucleosomes of each transcription unit. Genes are arranged by increasing size from top to bottom. Blue diagrams represent the relative nucleosome occupancy of the aggregated nucleosome profiles in the panels below. The data shown are from exponential mitotic diploid pat1.114 cells.
Figure 2
Figure 2
Nucleosome dynamics and transcription during mitosis and meiosis. (A), Nucleosome patterns across 15 kilobases of the S. pombe genome from exponential diploid pat1.114 cells (red) and from the same cells at the indicated times during synchronous meiosis (different shades of blue). Green arrowheads point to a nucleosome missing in meiosis at 0 h and to another present only in meiosis at 5 h. (B), Strand-specific transcriptional profile generated by tiling microarrays. The intensity of the green lines correlates with the level of expression. Blue pointed rectangles represent genes where the coding (blue) and non-coding (white) regions are indicated. The absence or presence of the two nucleosomes in panel (A) (green arrowheads) correlates with the up- or down-regulation of the adjacent transcripts at 0 h and 5 h of meiosis, respectively.
Figure 3
Figure 3
Nucleosome positioning across differentially transcribed genes. (A), Relative nucleosome occupancy of four sets of 50 genes each with 4-, 16-, 64- and 180-fold expression levels relative to the background level during mitosis as detected by tiling microarray analysis. (B), The positioned nucleosome profile of genes is lost in the pyk1, psu1 and sks2 genes, which are expressed over 180-fold relative to the background (see text for details). Transcription from both DNA strands (−) and (+) is shown. The profile of RNA polymerase II occupancy has been previously reported [32].
Figure 4
Figure 4
Meiosis-specific NDRs overlap with clusters of binding sites for meiosis-specific transcription factors. The mitosis and meiosis-specific expression pattern (green tracks) of the (A) rgs1, mei2 and omt2, (B) meu31 and meu17 and (C) rsv1 genes is associated with meiosis-specific NDRs immediately upstream from their TSS. The nucleosomal profiles of the regions encompassing these genes during mitosis and at the indicated times of meiosis are shown. Sites of binding for the Ste11 (green), Mei4 (red) and Rsv1 (black) transcription factors are indicated by vertical lines.
Figure 5
Figure 5
NDRs of cell cycle-regulated and stress response genes overlap with different clusters of binding sites for transcription factors. (A) The cdc22, mik1 and SPCC306.11 genes are periodically expressed during the mitotic cell cycle. Clusters of binding sites for six different transcription factors [36] are indicated by vertical lines: (purple, Ace2; dark blue, FKH; green, MBF; black, Dbl10; orange and light blue, overrepresented motifs not associated to previously identified factors. (B) The mug143 and srk1 genes are overexpressed under oxidative stress. Binding sites for two transcription factors are indicated (see text for details). The nucleosome profile across the five regions in mitotic cells is shown on top of each diagram (red). The transcribed DNA strand during mitosis in the absence of stress corresponding to the five genes described above is shown (green).
Figure 6
Figure 6
Transcription factors are required for the maintenance of NDRs. Nucleosomal and NDR patterns generated by tiling microarrays of control cells (972 h-) and of atf1Δ and pcr1Δ mutants are represented by black, red and blue lines, respectively. Sites of Atf1 and Pcr1 binding mapped by ChIP/Chip [49] are indicated by red and blue arrowheads. Black arrows indicate NDRs that disappear in the absence of Atf1 or Pcr1 and white arrows point to NDRs not bound by Atf1 and Pcr1 that remain invariable in the three strains. Strand-specific transcription profiles for the three strains are shown in green. Alternative transcription start sites of the SPAC22F8.05 (top diagram) and SPAC922.04 (bottom diagram) genes associated with the closing of NDRs dependent on Atf1 and Pcr1, are indicated by brackets.

Similar articles

Cited by

References

    1. Luger K, Dechassa ML, Tremethick DJ. New insights into nucleosome and chromatin structure: an ordered state or a disordered affair? Nat Rev Mol Cell Biol. 2012;13:436–447. doi: 10.1038/nrm3382. - DOI - PMC - PubMed
    1. Yuan GC, Liu YJ, Dion MF, Slack MD, Wu LF, Altschuler SJ, Rando OJ. Genome-scale identification of nucleosome positions in S. cerevisiae. Science. 2005;309:626–630. doi: 10.1126/science.1112178. - DOI - PubMed
    1. Lee W, Tillo D, Bray N, Morse RH, Davis RW, Hughes TR, Nislow C. A high-resolution atlas of nucleosome occupancy in yeast. Nat Genet. 2007;39:1235–1244. doi: 10.1038/ng2117. - DOI - PubMed
    1. Lantermann AB, Straub T, Stralfors A, Yuan GC, Ekwall K, Korber P. Schizosaccharomyces pombe genome-wide nucleosome mapping reveals positioning mechanisms distinct from those of Saccharomyces cerevisiae. Nat Struct Mol Biol. 2010;17:251–257. doi: 10.1038/nsmb.1741. - DOI - PubMed
    1. Tsankov A, Yanagisawa Y, Rhind N, Regev A, Rando OJ. Evolutionary divergence of intrinsic and trans-regulated nucleosome positioning sequences reveals plastic rules for chromatin organization. Genome Res. 2011;21:1851–1862. doi: 10.1101/gr.122267.111. - DOI - PMC - PubMed

Publication types

MeSH terms