. 2014 Feb;13(2):179-94.
doi: 10.1111/gbb.12108. Epub 2013 Dec 30.

Localization and behaviors in null mice suggest that ASIC1 and ASIC2 modulate responses to aversive stimuli

Affiliations

Localization and behaviors in null mice suggest that ASIC1 and ASIC2 modulate responses to aversive stimuli

M P Price et al. Genes Brain Behav. 2014 Feb.

Abstract

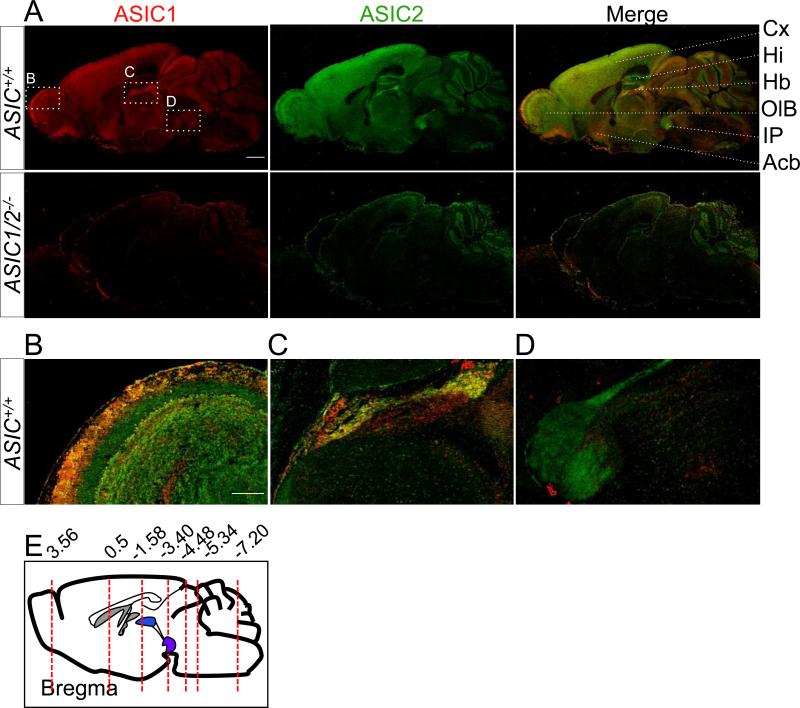
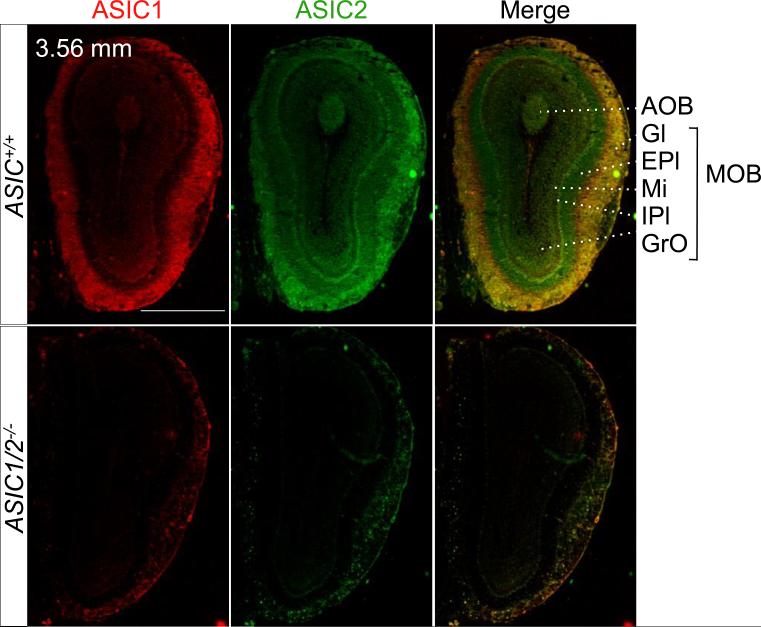
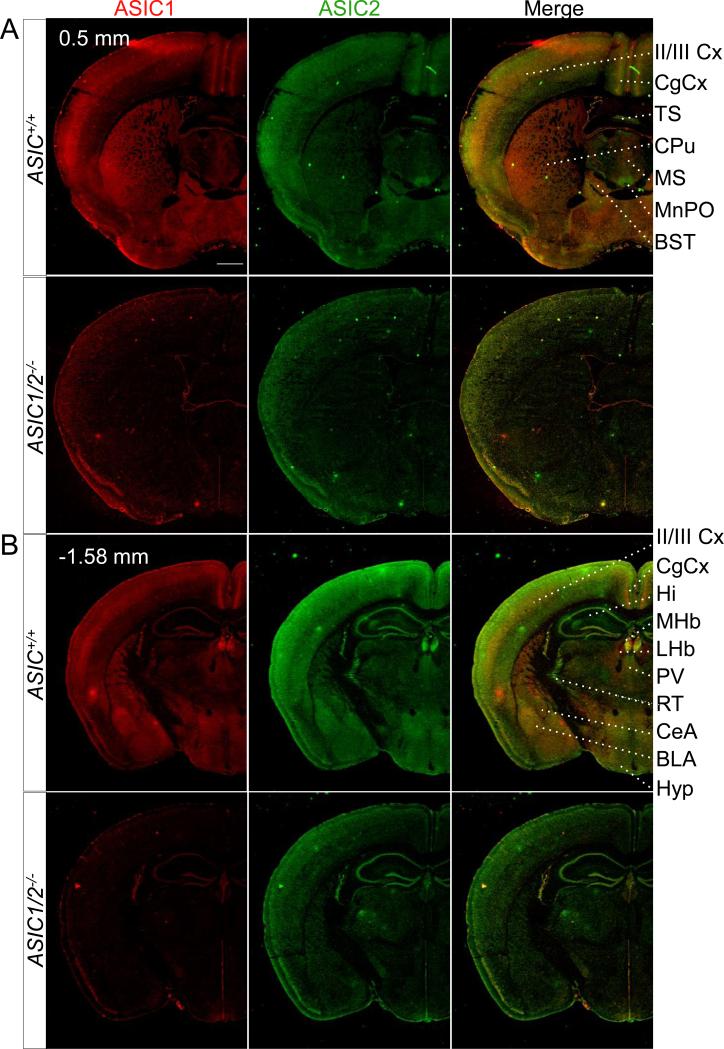
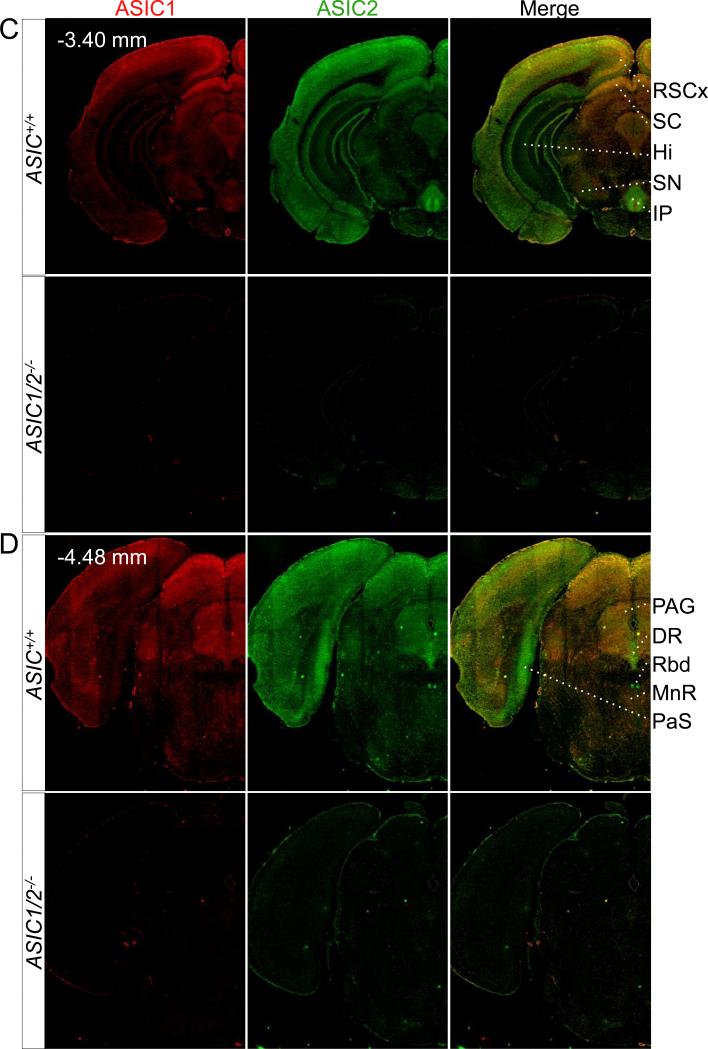
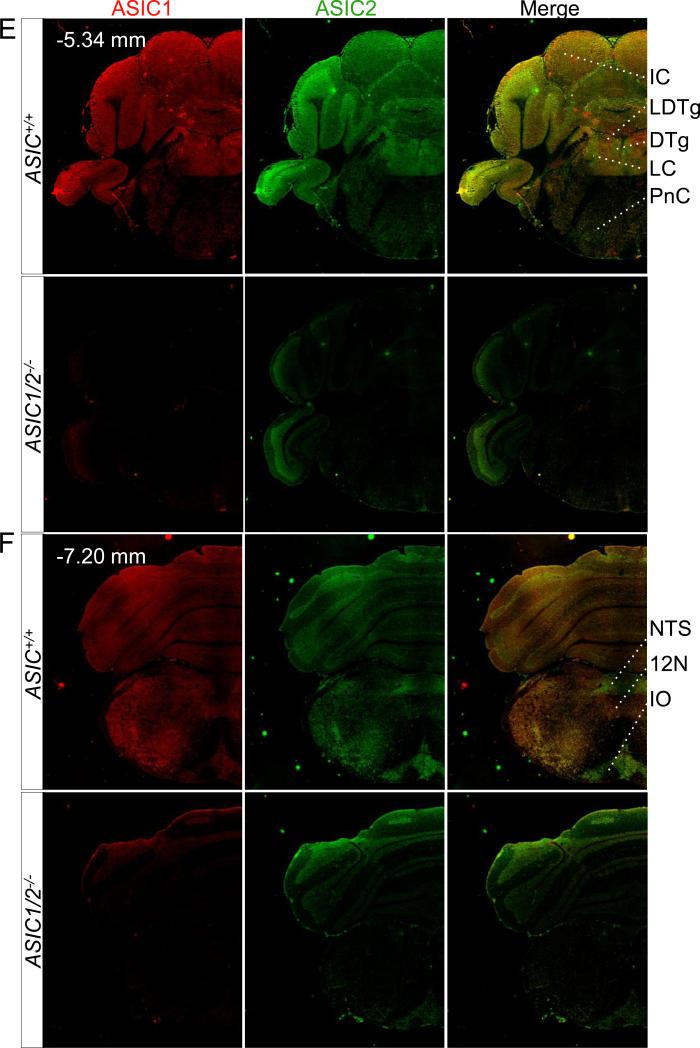
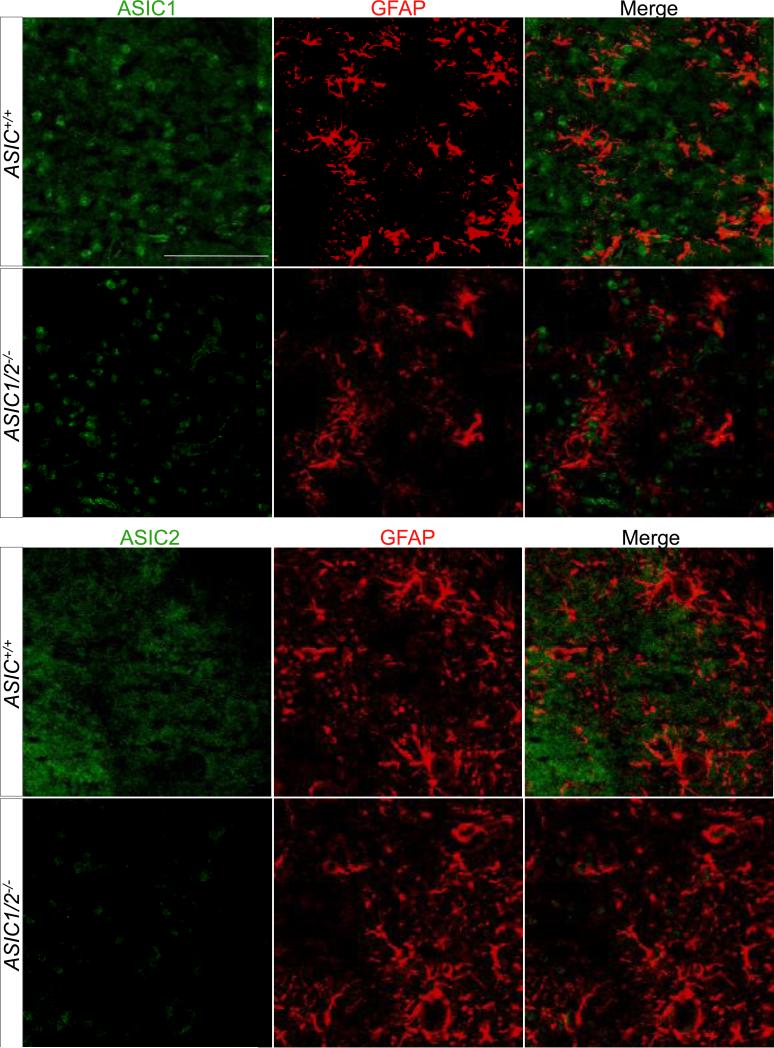
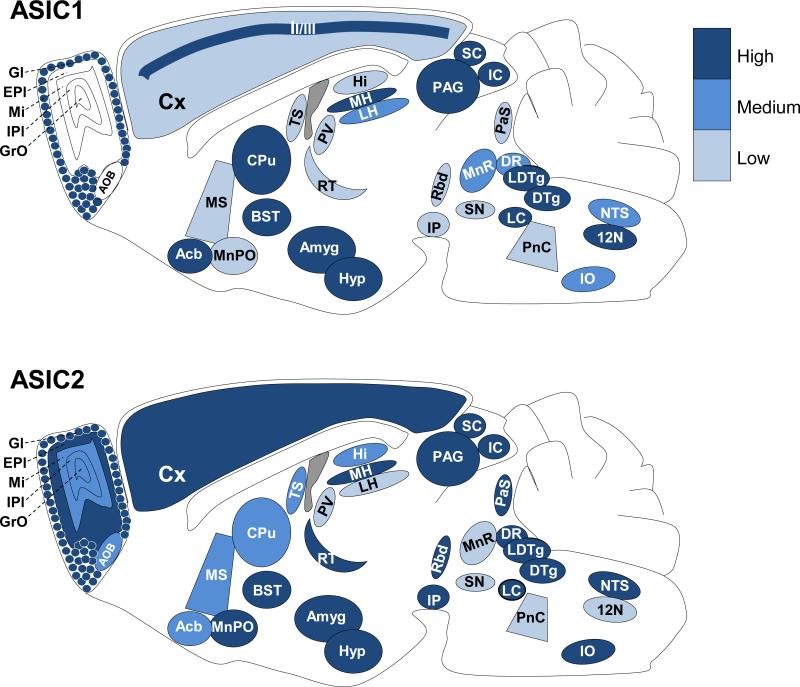
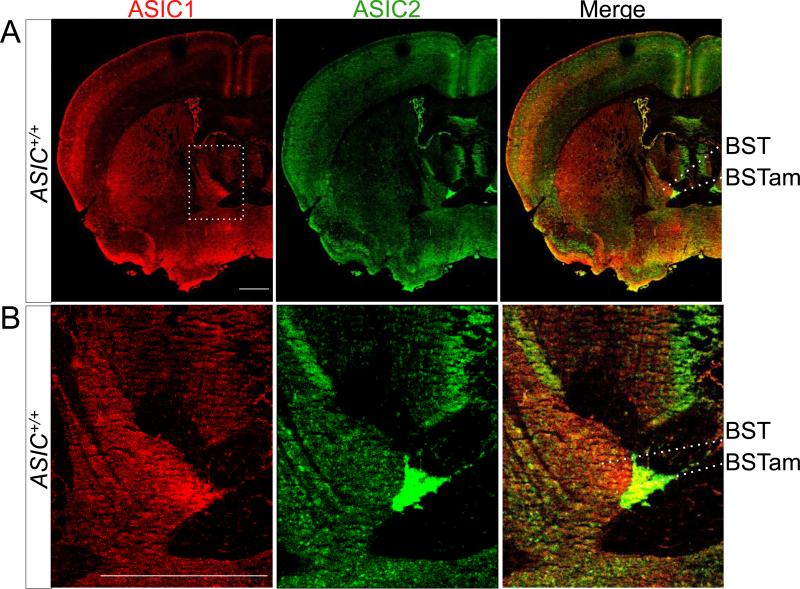
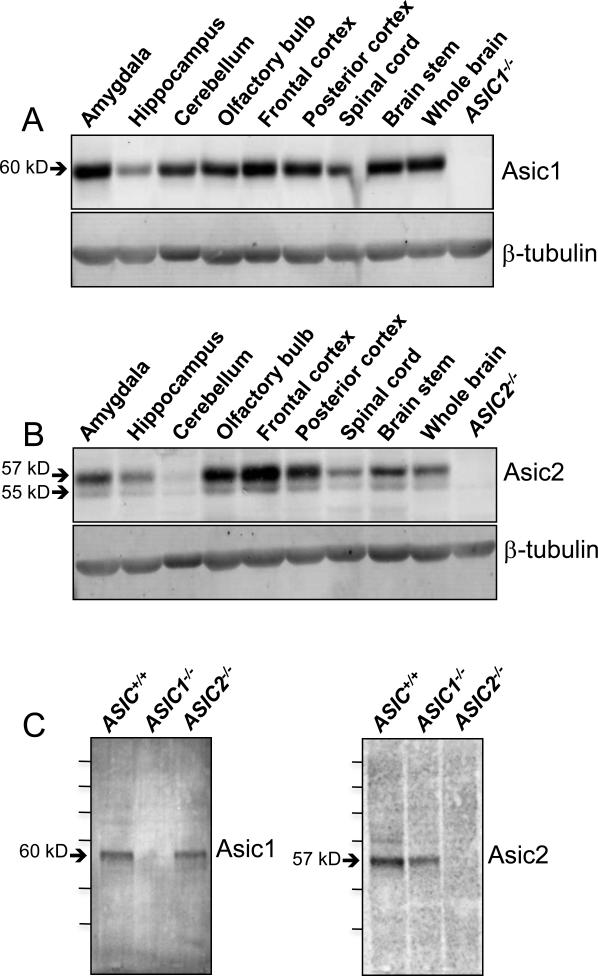
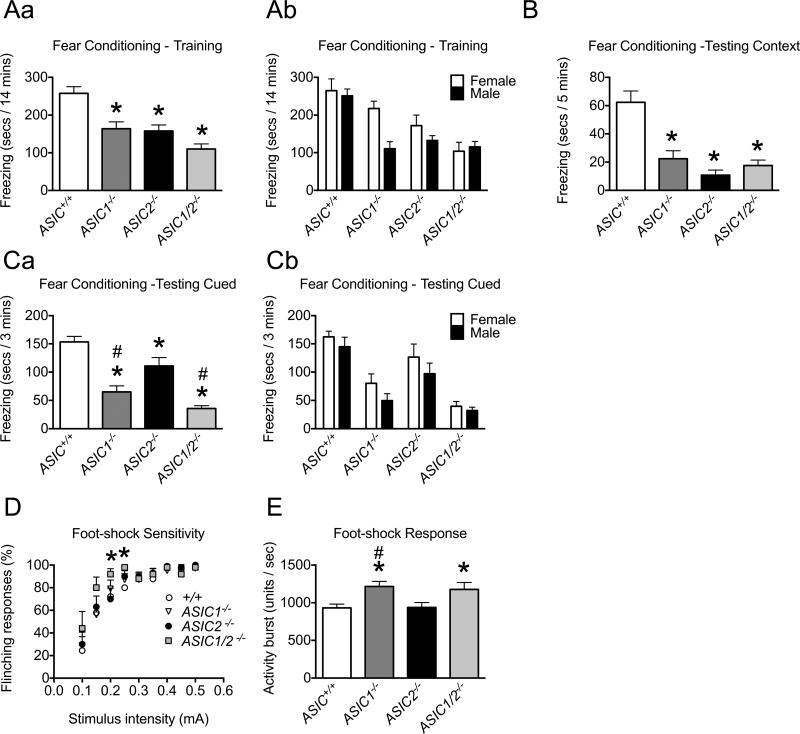
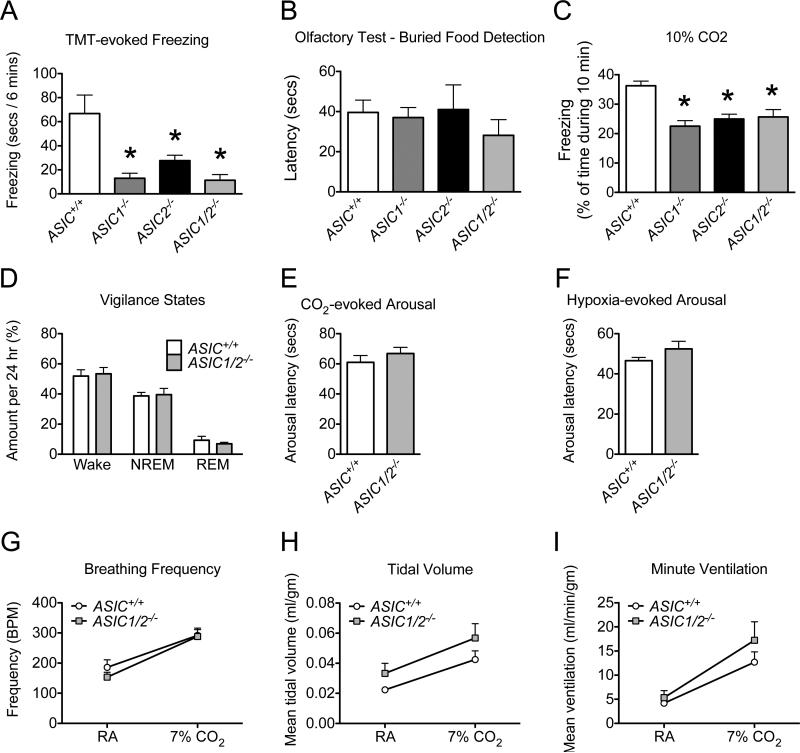
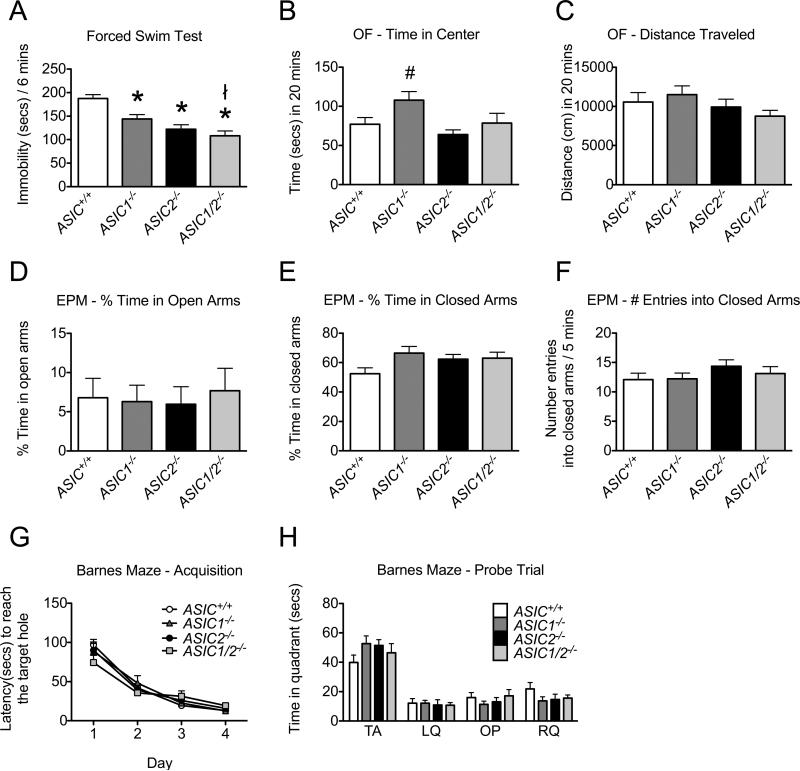
Acid-sensing ion channels (ASICs) generate H(+) -gated Na(+) currents that contribute to neuronal function and animal behavior. Like ASIC1, ASIC2 subunits are expressed in the brain and multimerize with ASIC1 to influence acid-evoked currents and facilitate ASIC1 localization to dendritic spines. To better understand how ASIC2 contributes to brain function, we localized the protein and tested the behavioral consequences of ASIC2 gene disruption. For comparison, we also localized ASIC1 and studied ASIC1(-/-) mice. ASIC2 was prominently expressed in areas of high synaptic density, and with a few exceptions, ASIC1 and ASIC2 localization exhibited substantial overlap. Loss of ASIC1 or ASIC2 decreased freezing behavior in contextual and auditory cue fear conditioning assays, in response to predator odor and in response to CO2 inhalation. In addition, loss of ASIC1 or ASIC2 increased activity in a forced swim assay. These data suggest that ASIC2, like ASIC1, plays a key role in determining the defensive response to aversive stimuli. They also raise the question of whether gene variations in both ASIC1 and ASIC2 might affect fear and panic in humans.

Keywords: ASIC1; ASIC2; Acid-sensing ion channel; brain; carbon dioxide; fear conditioning; immunocytochemistry.


Figures

Figure 1
Figure 1. Co-immunolocalization of ASIC1 and ASIC2 in mouse brain
A. Co-immunostaining of ASIC1 (red) and ASIC2 (green) in para-sagittal sections of mouse brain from ASIC+/+ and ASIC1/2−/− mice. Scale bar represents 1 mm. Enlarged images of the olfactory bulb (B), habenula (C), and interpeduncular nucleus (D). Scale bar represents 250 μm. E. Coronal sections were cut at various bregma (red dotted lines) for further staining. Acb, accumbens nucleus. Cx, cortex; Hb, habenula; Hi, hippocampus; IP, interpeduncular nucleus; OlB, olfactory bulb.
Figure 2
Figure 2. Co-immunolocalization of ASIC1 and ASIC2 in the olfactory bulb
Co-immunostaining of ASIC1 (red) and ASIC2 (green) in coronal sections of the main and accessory olfactory bulbs from ASIC1+/+ and ASIC1/2−/− mice. Sections were cut at bregma 3.56 mm of ASIC+/+ and ASIC1/2−/− mouse brains as indicated. Scale bar represents 1 mm. AOB, accessory olfactory bulb; EPl, external plexiform layer; Gl, glomerular layer; GrO, granule layer; IPl, internal plexiform layer; MOB, main olfactory bulb; Mi, mitral layer.
Figure 3
Figure 3. Co-immunolocalization of ASIC1 and ASIC2 in specific coronal sections throughout the brain
Co-immunostaining of ASIC1 (red) and ASIC2 (green) in coronal sections of ASIC+/+ and ASIC1/2−/− mouse brains, cut at bregma indicated in A, B, C, D, E, and F. Scale bar represents 800 μm. BLA, basolateral amygdala; BST, bed nucleus of the stria terminalis; CPu, caudate-putamen; CeA, central amygdala; CgCx, cingulate cortex; DR, dorsal raphe; DTg, dorsal temental nucleus, pericentral part; Hi, hippocampus; 12N, hypoglossal nucleus; Hyp, hypothalamus; IC, inferior colliculus; IO, inferior olive. IP, interpeduncular nucleus; LDTg, lateral dorsal tegmental nucleus; LHb, lateral habenula; II/III Cx, layer II/III in cortex; LC, locus cerulius; MHb, medial habenula; ; MS, medial septal nucleus; MnPO, median preoptic nucleus; MnR, median raphe; NTS, nucleus of the solitary tract; PaS, parasubiculum; PV, paraventricular thalamic nucleus; PAG, periaqueductal gray; PnC, pontine reticular nucleus; RT, reticular thalamic nucleus; RSCx, retrosplenial cortex; Rbd, rhabdoid nucleus; SN, substantia nigra; SC, superior colliculus; TS, triangular segment.
Figure 4
Figure 4. Co-immunolocalization of ASIC1 and ASIC2 with glial fibrillary acidic protein (GFAP)
Co-immunostaining of ASIC1 and ASIC2 (both in green) with glial fibrillary acidic protein (GFAP) (red) in regions of mouse brain where ASIC1 and ASIC2 are highly expressed (ASIC1 in the PAG and ASIC2 in the IPN). Scale bar represents 100 μm.
Figure 5
Figure 5. Depiction of ASIC1 and ASIC2 localization throughout the brain
Brain schematic depicting relative levels of immunostaining of ASIC1 (top) and ASIC2 (bottom) in the indicated structures in mouse brain.
Figure 6
Figure 6. Co-immunolocalization of ASIC1 and ASIC2 in the BST
A. Co-immunostaining of ASIC1 (red) and ASIC2 (green) in coronal section of mouse forebrain. B. Enlarged image of the anterior medial area of the BST. Scale bar in (A) and (B) represents 800 μm.
Figure 7
Figure 7. Western blot analysis of ASIC1 and ASIC2 in protein extracts of dissected regions of mouse brain
A. Western blotting with anti-ASIC1 antibody; right lane contained whole brain lysate from an ASIC1−/− brain. B. Western blotting with anti-ASIC2 antibody; right lane contained whole brain lysate from an ASIC2−/− brain. Blotting for ß-tubulin served as a control for the amount of protein loaded in each lane. C. Western blotting of whole brain lysate from ASIC+/+, ASIC1−/−, and ASIC2−/− mice with anti-ASIC1 or anti-ASIC2 antibody as indicated. Protein MW markers, from top to bottom are as follows in kD: 250, 150, 100, 75, 50, 37.
Figure 8
Figure 8. Behavioral analyses of ASIC+/+ and ASIC−/− mice in conditioned fear assays
A. Context and cue fear training. ASIC1−/−, ASIC2−/−, and ASIC1/2−/− mice froze significantly less than ASIC+/+ mice during the 14 min training period (* difference compared with ASIC+/+ (P < 0.05), post-hoc Holm's correction; ASIC+/+, n = 31, 16 male, 15 female; ASIC1−/−, n = 20, 10 male, 10 female; ASIC2−/−, n = 17, 9 male, 8 female; ASIC1/2−/−, n = 21, 11 male, 10 female). Male and female data are reported together in Aa and separately in Ab. B. Context fear testing. ASIC1−/−, ASIC2−/−, and ASIC1/2−/− mice froze significantly less than ASIC+/+ mice during 5 min testing to context (* difference compared with ASIC+/+ (P < 0.05), post-hoc Holm's correction; ASIC+/+, n = 26, 14 male, 12 female; ASIC1−/−, n = 20, 10 male, 10 female; ASIC2−/−, n = 17, 9 male, 8 female; ASIC1/2−/−, n = 12, 6 male, 6 female). C. Auditory cue fear testing. ASIC1−/−, ASIC2−/−, and ASIC1/2−/− mice froze significantly less than ASIC+/+ mice, and ASIC1−/− and ASIC1/2−/− froze significantly less than ASIC2−/− mice during the 3 min tone-on period of the 10 min session; freezing during the tone-off period of the session was negligible (* difference compared with ASIC+/+ (P < 0.05), # difference compared with ASIC2−/− (P < 0.05), post-hoc Holm's correction; ASIC+/+, n = 31, 16 male, 15 female; ASIC1−/−, n = 20, 10 male, 10 female; ASIC2−/−, n = 17, 9 male, 8 female; ASIC1/2−/−, n = 21, 11 male, 10 female). Male and female data are reported together in Ca and separately in Cb. D. Foot-shock sensitivity. Percentage of foot-shock stimuli that elicited a flinching response. Foot-shocks were delivered at increasing levels of intensity; there were 10 presentations at each intensity. There were significant differences in foot-shock sensitivity between ASIC+/+ and ASIC1/2−/− at intensities of 0.20 mA and 0.25 mA (* difference compared with ASIC+/+ (P < 0.05), post-hoc Bonferroni correction; ASIC+/+, n = 9, 9 male; ASIC1−/−, n = 10, 10 male; ASIC2−/−, n = 10, 10 male; ASIC1/2−/−, n = 5, 5 male). E. Foot-shock response. The unconditioned activity burst during the first second following the initial foot-shock (measured using the motion index function of the Video Freeze software) was used to quantify the response to foot-shock. ASIC1−/− and ASIC1/2−/− mice had a significantly greater activity burst than ASIC+/+ mice and ASIC1−/− mice had a significantly greater activity burst than ASIC2−/− mice (* difference compared with ASIC+/+ (P < 0.05), # difference compared with ASIC2−/− (P < 0.05), post-hoc Holm's correction; ASIC+/+, n = 31, 16 male, 15 female; ASIC1−/−, n = 20, 10 male, 10 female; ASIC2−/−, n = 17, 9 male, 8 female; ASIC1/2−/−, n = 21, 11 male, 10 female). Values are expressed as mean + SEM. A detailed statistical analysis for all parameters is provided in Table S1.
Figure 9
Figure 9. Behavioral analyses of ASIC+/+ and ASIC−/− mice in assays of innate fear and CO2-evoked responses
A. Unconditioned fear. ASIC1−/−, ASIC2−/−, and ASIC1/2−/− mice froze significantly less than ASIC+/+ mice in response to TMT during the 6 min trial period (* difference compared with ASIC+/+ (P < 0.05), post-hoc Holm's correction; ASIC+/+, n = 9, 5 male, 4 female; ASIC1−/−, n = 9, 4 male, 5 female; ASIC2−/−, n = 8, 4 male, 4 female; ASIC1/2−/−, n = 5, 2 male, 3 female). B. Olfaction. There were no statistical differences in the latency to find a buried food pellet between genotypes or sex (ASIC+/+, n = 7, 3 male, 4 female; ASIC1−/−, n = 7, 3 male, 4 female; ASIC2−/−, n = 11, 6 male, 5 female; ASIC1/2−/−, n = 11, 6 male, 5 female). C. CO2-evoked freezing. ASIC1−/−, ASIC2−/−, and ASIC1/2−/− mice spent a significantly smaller percentage of time freezing than ASIC+/+ mice during the 10 min trial period when exposed to 10% CO2 (* difference compared with ASIC+/+ (P < 0.05), post-hoc Holm's correction; ASIC+/+, n = 18, 18 male; ASIC1−/−, n = 14, 14 male; ASIC2−/−, n = 16, 16 male; ASIC1/2−/−, n = 12, 12 male). D. Sleep/wake patterns. % of time spent in each vigilance state - awake (wake), non-rapid eye movement sleep (NREM), and rapid eye movement sleep (REM) - during the 24 h trial period. There was no statistical evidence of differences between genoytpes in % of time spent in NREM vs. wake states. We only considered NREM and wake states in the analysis of vigilance states since the total of REM, NREM, and wake times were constrained to 24 h. (ASIC+/+, n = 8, 8 male; ASIC1/2−/−, n = 8, 8 male.) E. CO2-evoked arousal. There was no statistical evidence of differences between genotypes in latency to arousal when placed in 7% CO2. (ASIC+/+, n = 8, 8 male; ASIC1/2−/−, n = 8, 8 male). F. O2-evoked arousal. There was no statistical evidence of differences between genotypes in latency to arousal when placed in 5% O2. (ASIC+/+, n = 8, 8 male; ASIC1/2−/−, n = 8, 8 male.) G, H, and I. There was no statistical evidence of differences between genotypes in breathing frequency (breaths/min) (G), tidal volume (normalized to weight) (H), or ventilation (normalized to weight) (I) while breathing room air (RA) and 7%CO2. (ASIC+/+, n = 8, 8 male; ASIC1/2−/−, n = 8, 8 male.) Values are expressed as mean + SEM. A detailed statistical analysis for all parameters is provided in Table S1.
Figure 10
Figure 10. Behavioral analyses of ASIC+/+ and ASIC−/− mice in forced swim, open field, elevated plus maze, and Barnes maze assays
A. Depression-related behavior. ASIC1−/−, ASIC2−/−, and ASIC1/2−/− mice spent less time immobile than ASIC+/+ mice, and ASIC1−/− mice spent less time immobile than ASIC1/2−/− mice during the 6 min trial period of the Porsolt forced swim test (* difference compared with ASIC+/+ (P < 0.05), ł difference compared with ASIC1−/−(P < 0.05), post-hoc Holm's correction; ASIC+/+, n = 28, 14 male, 14 female; ASIC1−/−, n = 27, 16 male, 11F; ASIC2−/−, n = 25, 12 male, 13 female; ASIC1/2−/−, n = 23, 12 male, 11 female). Average weights of different groups: ASIC+/+, 21.5 g; ASIC1−/−, 23.3 g; ASIC2−/−, 22.8 g; ASIC1/2−/−, 20.7g. B, C. Open field test. ASIC1−/− mice spent more time than ASIC2−/− mice in the central zone of an open field area during a 20 min trial period (# difference compared with ASIC2−/− (P < 0.05), post-hoc Holm's correction) (B). There was no statistical evidence of differences in the distance travelled in an open field between genotypes or sex during this trial period (C). (ASIC+/+, n = 21, 7 male, 14 female; ASIC1−/−, n = 26, 14 male, 12 female; ASIC2−/−, n = 28, 14 male, 14 female; ASIC1/2−/−, n = 19, 9 male, 10 female.) D, E, and F. Elevated plus maze. There was no statistical evidence of differences between genotypes or sex in % time animals spent in open (D) or closed (E) arms of the elevated plus maze or the number of entries into the closed arms (F) during a 5 min trial period. (ASIC+/+, n = 11, 5 male, 6 female; ASIC1−/−, n = 9, 5 male, 4 female; ASIC2−/−, n = 11, 6 male, 5 female; ASIC1/2−/−, n = 8, 3 male, 5 female.) G, H. Barnes Maze. There was no statistical evidence of differences between genotypes or sex in latency to reach the target hole during the training days (G). (ASIC+/+, n = 12, 6 male, 6 female; ASIC1−/−, n = 12, 6 male, 6 female ; ASIC2−/−, n = 12, 6 male, 6 female; ASIC1/2−/−, n = 11, 5 male, 6 female.) There was no statistical evidence of differences between genotypes in time spent in specific quadrants during the probe test following the training days (H). TA indicates target quadrant; LQ indicates adjacent left quadrant; OP indicates opposite quadrant; RQ indicates adjacent right quadrant. (ASIC+/+, n = 10, 4 male, 6 female; ASIC1−/−, n = 10, 4 male, 6 female; ASIC2−/−, n = 10, 5 male, 5 female; ASIC1/2−/−, n = 11, 5 male, 6 female.) Values are expressed as mean + SEM. A detailed statistical analysis for all parameters is provided in Table S1.

Similar articles

Cited by

References

    1. Alvarez de la Rosa D, Krueger SR, Kolar A, Shao D, Fitzsimonds RM, Canessa CM. Distribution, subcellular localization and ontogeny of ASIC1 in the mammalian central nervous system. J Physiol. 2003;546:77–87. - PMC - PubMed
    1. Anagnostaras SG, Josselyn SA, Frankland PW, Silva AJ. Computer-assisted behavioral assessment of Pavlovian fear conditioning in mice. Learn Mem. 2000;7:58–72. - PMC - PubMed
    1. Anagnostaras SG, Maren S, Sage JR, Goodrich S, Fanselow MS. Scopolamine and Pavlovian fear conditioning in rats: dose-effect analysis. Neuropsychopharmacology. 1999;21:731–744. - PubMed
    1. Anagnostaras SG, Wood SC, Shuman T, Cai DJ, Leduc AD, Zurn KR, Zurn JB, Sage JR, Herrera GM. Automated assessment of pavlovian conditioned freezing and shock reactivity in mice using the video freeze system. Front Behav Neurosci. 2010;4 - PMC - PubMed
    1. Askwith CC, Wemmie JA, Price MP, Rokhlina T, Welsh MJ. Acid-sensing ion channel 2 (ASIC2) modulates ASIC1 H+-activated currents in hippocampal neurons. J Biol Chem. 2004;279:18296–18305. - PubMed

Publication types

LinkOut - more resources