. 2013 Nov 28;503(7477):481-486.
doi: 10.1038/nature12804. Epub 2013 Nov 20.

Memory and modularity in cell-fate decision making

Affiliations

Memory and modularity in cell-fate decision making

Thomas M Norman et al. Nature. .

Abstract

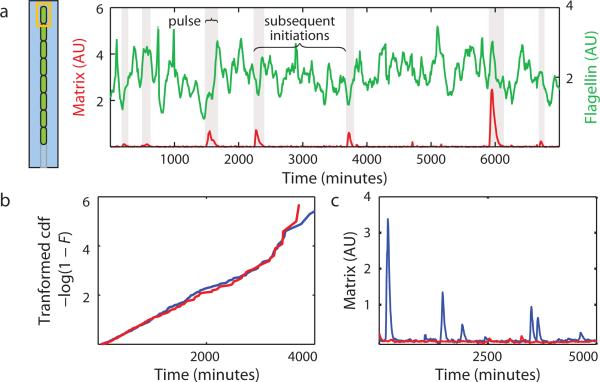
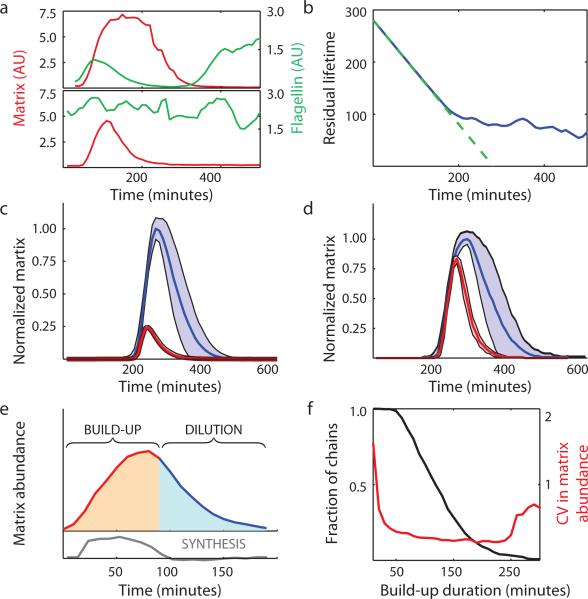
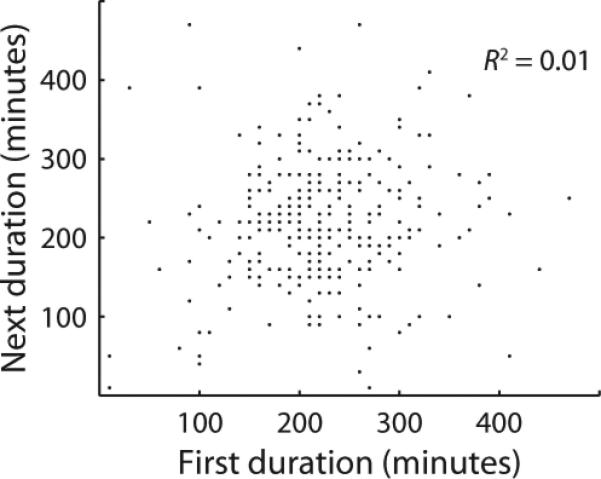
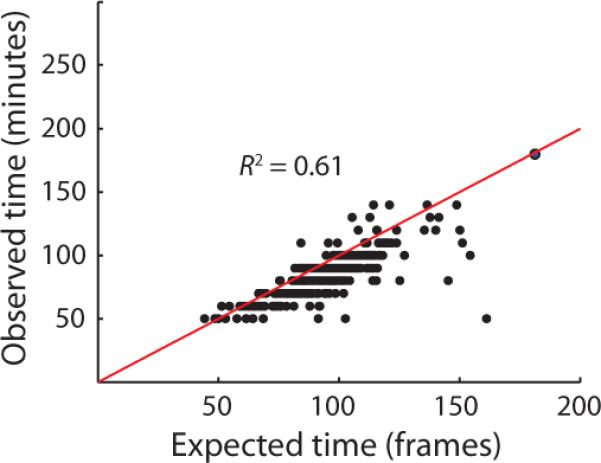
Genetically identical cells sharing an environment can display markedly different phenotypes. It is often unclear how much of this variation derives from chance, external signals, or attempts by individual cells to exert autonomous phenotypic programs. By observing thousands of cells for hundreds of consecutive generations under constant conditions, we dissect the stochastic decision between a solitary, motile state and a chained, sessile state in Bacillus subtilis. We show that the motile state is 'memoryless', exhibiting no autonomous control over the time spent in the state. In contrast, the time spent as connected chains of cells is tightly controlled, enforcing coordination among related cells in the multicellular state. We show that the three-protein regulatory circuit governing the decision is modular, as initiation and maintenance of chaining are genetically separable functions. As stimulation of the same initiating pathway triggers biofilm formation, we argue that autonomous timing allows a trial commitment to multicellularity that external signals could extend.


Figures

Figure 1
Figure 1. Tracking cell fate switching in Bacillus subtilis
a, Genetic logic governing the motile and chained states. b, Top and isometric schematics of microfluidic channels in which individual bacteria are held. Channels connect to a larger channel through which medium is continuously replaced and excess cells are washed away. c, Kymograph showing a single cell (highlighted in yellow) of strain TMN690 (Phag-gfp PtapA-mKate2 hagA233V) transitioning from motile growth (marked in green by expression of a Phag-gfp reporter for flagellin) to chained growth (marked in red by expression of a PtapA-mKate2 reporter for matrix expression). Frames taken ten minutes apart. d, Kymograph showing co-expression of matrix and slr reporters in TMN1180 cells (PtapA-cfp Pslr-mKate2 hagA233V). e, Average co-expression profiles of matrix and slr reporter expression in chains (TMN1180, 25 events).
Figure 2
Figure 2. Dynamics of cell fate switching
This figure examines chaining in strain TMN1157 (Phag-mKate2 PtapA-cfp hagA233V). a, The uppermost cell's fate was tracked in each channel, yielding traces of flagellin (Phag-mKate2, green curve) and matrix (PtapA-cfp, red curve) reporter expression. Five chaining events are shaded. b, Correlation between subsequent residence times in the motile state. c, Schematic of aging curves. Memoryless switching (blue dashed curve) between states gives rise to horizontal curves, while deterministic timers (red dashed curve) create curves descending with slope −1 from the average duration of the state 〈T〉. Many other mechanisms are bounded by these extremes (SI): e.g., progression through a series of discrete, exponentially distributed steps yields the grey curve. d, Distribution of motility periods (307 events). Red curve shows exponential fit. Inset shows log transformed cumulative distribution function of motility period duration (black curve) and the exponential fit (red curve). e, The aging curve for the motile state (black line) is compared to the expectation for memoryless switching adjusted for undersampling of long motility periods (blue dashed curve, SI) and that for a timer (green dashed curve). f, Distribution of chain durations (440 events). g, Aging curves for chains (blue curve) in cells wild type for slr (TMN1157) and pulses (red curve) in slr mutant cells (TMN1158, which is TMN1157 mutated for slr). All qualitative features of distributions were replicated in at least three separate experiments and quantitative parameters in at least two.
Figure 3
Figure 3. Memoryless initiation of chaining
a, An example trace of flagellin (Phag-mKate2, green curve) and matrix (PtapA-cfp, red curve) reporter expression from slr mutant cells (TMN1158). Seven matrix pulses are shaded. b, Log transformed cumulative distribution functions of times between subsequent initiations (of pulses or chains) in cells wild type (blue curve, TMN1157, 399 events) or mutant for slr (red curve, TMN1158, 296 events) strains. Plotted this way, exponential distributions yield straight lines. This result separately reproduced in a strain with different fluorescent reporter proteins. c, Example matrix expression traces in slr mutant cells (blue curve, TMN1158), and in slr mutant cells further deleted for the initiator I (red curve, TMN1198).
Figure 4
Figure 4. Slr executes a stereotyped chaining program
a, Example matrix and flagellin traces from strains where chaining (top panel, TMN1195 = Phag-mKate2 PtapA-cfp hagA233V Pspank-sinI) or pulsing (bottom panel, TMN1196, which is TMN1195 mutated for slr) were inducible by addition of IPTG. b, Aging curve for induced chains is shown (177 events). Green dashed curve shows expectation for a timer. c, Average matrix expression profiles for chains arising spontaneously (blue curve, TMN1157, 198 events) and pulses arising spontaneously in slr mutant cells (red curve, TMN1158, 278 events). Shaded regions denote ± 1 standard deviation. Average profiles are scaled to reflect the average height difference between chains and pulses. d, The same analysis for chains (blue curve, TMN1195, 26 events) and pulses (red curve, TMN1196, 42 events) induced by addition of IPTG. e, Matrix expression during chaining naturally breaks down into a build-up phase (red curve), where synthesis of new proteins dominates, and a subsequent dilution phase (blue curve). Grey curve shows the calculated synthesis rate (SI) used to call the two phases. f, Long build-up phases reduce noise in matrix expression by time averaging. The plot shows the fraction of chains achieving a build-up phase of a given duration (black curve) and the variability in matrix expression of those chains (red curve). Similar results have been obtained in three replicate experiments.
Extended Data 1
Extended Data 1. Aging behavior is independent of choice of threshold
Initially, the duration of a chaining event was called as the time between when matrix expression was first detectable to when flagellin expression began to increase. However, in order to compare chains (in strain TMN1157) and pulses (in strain TMN1158), we examined whether it was possible to call the end point using only the matrix reporter since flagellin expression does not fall during pulses. In both methods, the beginning of a chain was called as the time when the matrix signal was first detectable above background fluctuations (~33 fluorescence units, SI). a, To call the end of a chain using only the matrix signal, various thresholds were applied. The figure plots the difference in chain duration between this single reporter method for different thresholds and the two reporter method. A threshold of 150 fluorescence units called the duration of chaining to within 20 minutes of the two reporter method and was used throughout the text to call the end of the events. b, To show that the primary conclusions are unchanged by the choice of threshold, the aging curves for the chained state are plotted for all thresholds shown in the previous panel. As the motile state is extremely long in comparison to the chained state, properties of the motile state are completely insensitive to how we called chains.
Extended Data 2
Extended Data 2. Cell growth is homogeneous in time
Sliding window average of division time plotted as a function of time (in strain TMN1158). Each point in the curve represents the average of all division times that occurred within a 250 minute window. Grey shaded area denotes ± 1 standard deviation, while red shaded error denotes ± 1 standard error of the mean. A flat trend indicates that conditions in the device do not change in time.
Extended Data 3
Extended Data 3. Chaining incidence is constant in time
Histogram of the number of chaining events observed in successive 330 minute windows in the experiment described in Figure 2 of the main text. As the number of observed lineages was constant throughout the experiment, these measurements reflect the average chaining rate in each window. A flat trend occurs when this average rate is constant in time, and thus that the factors controlling the switching decision have reached stationarity. Chains occurring early in the movie were excluded from subsequent analysis to avoid any transient effects associated with adapting to growth in the device (SI).
Extended Data 4
Extended Data 4. Successive visits to the chained state are uncorrelated
Scatter plot of the durations of sequential visits to the chained state within each wild type lineage (440 events), analogous to Figure 2b for the motile state. Note that some points fall on top of each other due to the discrete nature of the measurements.
Extended Data 5
Extended Data 5. Slr is expressed strongly only in chains
Average expression traces of slr during chains (blue curve, 25 events) and pulses (green curve, 14 events) seen in strain TMN1180 (PtapA-cfp Pslr-mKate2 hagA233V).
Extended Data 6
Extended Data 6. Chaining program is independent of cellular state
To test whether the initial state of the cell influenced the chaining program, cells (of strain TMN1195) were forced to chain with a burst of I expression from an IPTG-responsive I gene (created by switching to medium containing 100 μM IPTG for 10 minutes). When some cells began to return to the motile state (3 hours later), a second IPTG treatment was administered. a, Average matrix expression profiles in chains induced by single pulses of IPTG (blue curve) or two consecutive IPTG pulses (red curve). The average amount of time spent as a chain after the second IPTG treatment was similar to the time seen in the chained state following a single treatment (260 minutes vs. 280 minutes, 177 and 28 events, respectively). b, The plot scatters matrix expression level at the time of the second IPTG treatment against the duration of the ensuing chain, indicating that the state of the cell at the time of treatment had no effect on the subsequent chain duration. c, 10 minute (blue curve, 84 events) and 20 minute (red curve, 99 events) IPTG treatments were used to induce chaining, resulting in near identical distributions of chain durations. Note that the 10 minute data set contained two exceptionally long chaining events that explain the slightly higher average duration.
Extended Data 7
Extended Data 7. Strongly enhanced commitment to the chained state in strains overexpressing slr
The figure shows an example trace of a chain made by the strain TMN1206 (PtapA-cfp Phag-mKate2 hagA233V ywrK::PslrR-slrR), which bears an additional copy of the gene for Slr under its native promoter. In this strain, most chains last long enough that they are eventually pulled out by the flow of fresh medium running through the device. Using the time to fallout as a lower bound for the average duration of the chaining state suggests that the chained state lasts at least ~420 minutes (~15.5) generations in these cells.
Extended Data 8
Extended Data 8. Variation in matrix expression rate over time during build-up phase
As described in the main text, chaining events can be naturally broken down into a build-up period, when new synthesis dominates, and a subsequent dilution period where new synthesis is minimal. The rate of matrix reporter expression was calculated at each time point during the build-up period for all chaining events, producing a time-varying distribution of possible expression rates. The figure plots the coefficient of variation of this distribution, showing that expression rates show a roughly constant CV of ~0.5 over much of the build-up period. Note that most chains have ceased the build-up phase by about 250 minutes in, so the end of the graph is less informative. This figure should be compared with Figure 4f in the main text, which shows that the CV in the abundance of the matrix reporter decreases over the same period due to the time averaging principle described in the main text.
Extended Data 9
Extended Data 9. Dilution phase is well-described by a deterministic model for exponential decay
Scatter plot comparison of observed and predicted dilution phase durations in spontaneous chains. Expected dilution times were derived from a deterministic model for exponential decay of the reporter (SI). Close proximity to the line y = x (black line) indicates that the data are well-described by the model.
Extended Data 10
Extended Data 10. Image processing used for image quantification
a, Cells are identified using a constitutive YFP construct. b, Images are rotated so that channels are oriented vertically. c, Images are contrast enhanced to better identify cell boundaries. d, Cells are preliminarily identified by edge detection. e, The mask identifying cells is improved by morphological processing. f, Mother cells are identified (highlighted in white). g, Superposition of segmented cell boundaries and rotated data YFP image.

Comment in

References

    1. Ferrell JE, Jr, Machleder EM. The biochemical basis of an all-or-none cell fate switch in Xenopus oocytes. Science. 1998;280:895–898. - PubMed
    1. Wehrli M, Tomlinson A. Epithelial planar polarity in the developing Drosophila eye. Development. 1995;121:2451–2459. - PubMed
    1. Long T, et al. Quantifying the integration of quorum-sensing signals with single-cell resolution. PLoS Biol. 2009;7:e68. - PMC - PubMed
    1. Paulsson J. Summing up the noise in gene networks. Nature. 2004;427:415–418. - PubMed
    1. Ozbudak EM, Thattai M, Kurtser I, Grossman AD, van Oudenaarden A. Regulation of noise in the expression of a single gene. Nat. Genet. 2002;31:69–73. - PubMed

Publication types