Review
. 2013 Nov 19;14(11):22753-81.
doi: 10.3390/ijms141122753.

Opportunities for live cell FT-infrared imaging: macromolecule identification with 2D and 3D localization

Affiliations
Review

Opportunities for live cell FT-infrared imaging: macromolecule identification with 2D and 3D localization

Eric C Mattson et al. Int J Mol Sci. .

Abstract

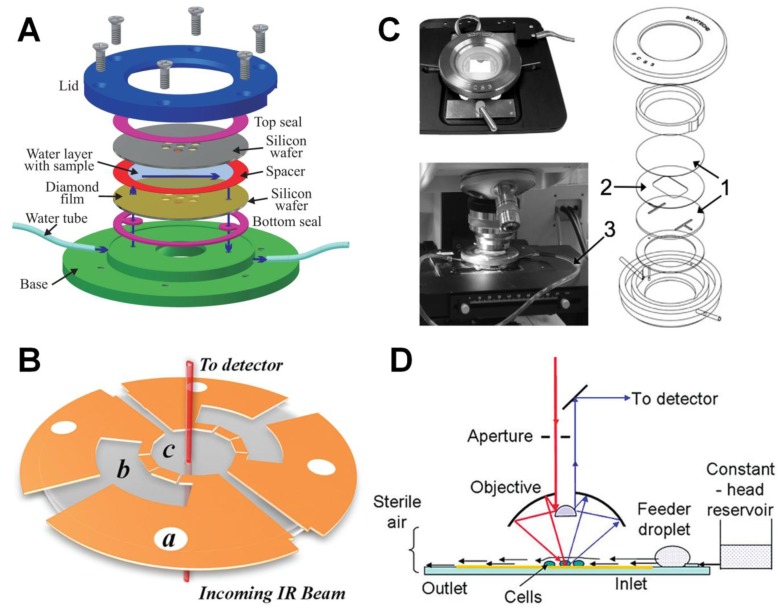
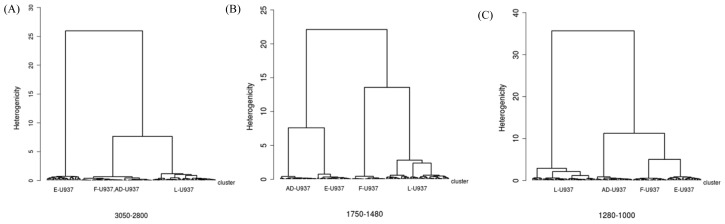
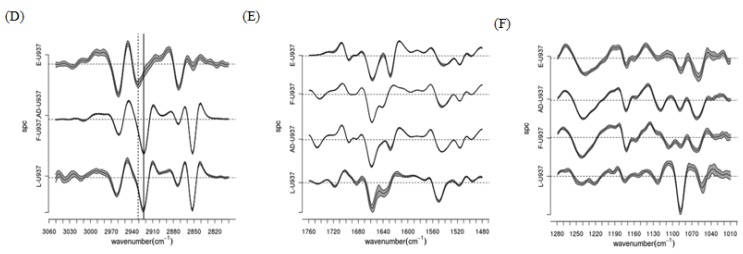
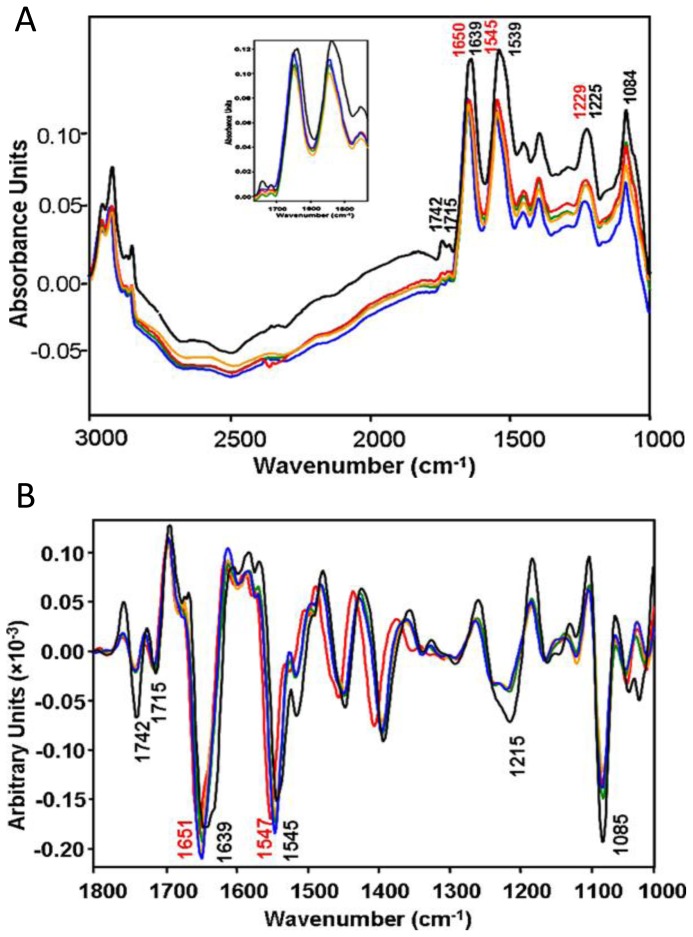
Infrared (IR) spectromicroscopy, or chemical imaging, is an evolving technique that is poised to make significant contributions in the fields of biology and medicine. Recent developments in sources, detectors, measurement techniques and speciman holders have now made diffraction-limited Fourier transform infrared (FTIR) imaging of cellular chemistry in living cells a reality. The availability of bright, broadband IR sources and large area, pixelated detectors facilitate live cell imaging, which requires rapid measurements using non-destructive probes. In this work, we review advances in the field of FTIR spectromicroscopy that have contributed to live-cell two and three-dimensional IR imaging, and discuss several key examples that highlight the utility of this technique for studying the structure and chemistry of living cells.


Figures

Figure 1
Figure 1
Different schemes of chambers for sustaining living cells. (A) Demountable liquid flow cell using submicrometer thick diamond windows [3]; (B) Fully-sealed microfluidic chamber employing 1 and 2 mm thick CaF2 windows as the top and bottom windows, separated by an 8.5 μm photoresist layer (Reprinted with permission from [6]. Copyright 2012 American Chemical Society); (C) Demountable liquid flow cell employing 2 mm thick CaF2 windows as the substrate and lid for the cell (Reprinted with permission from [14]. Copyright 2010 Elsevier); and (D) Open channel microfluidic design employed by Holman et al., consisting of 10–15 μm deep microchannels embedded onto a Si chip with controlled inlet and outlet pressures, (Reprinted with permission from [5]. Copyright 2009 American Chemical Society).
Figure 2
Figure 2
(AC) Dendrograms of the classification of vector normalized second derivatives of spectra from L-, F-, E- and AD-U937 monocytes as obtained by HCA (Euclidean distances, Wards’ algorithm) in the regions of (A) lipids; (B) proteins-phospholipids; and (C) nucleic acids-carbohydrates; (DF) centroids of the major classes identified by HCA in the (D) lipids; (E) proteins-phospholipids; and (F) nucleic acids-carbohydrates regions. Line thickness is proportional to standard deviation, (Reprinted with permission from [6]. Copyright 2012 American Chemical Society).
Figure 2
Figure 2
(AC) Dendrograms of the classification of vector normalized second derivatives of spectra from L-, F-, E- and AD-U937 monocytes as obtained by HCA (Euclidean distances, Wards’ algorithm) in the regions of (A) lipids; (B) proteins-phospholipids; and (C) nucleic acids-carbohydrates; (DF) centroids of the major classes identified by HCA in the (D) lipids; (E) proteins-phospholipids; and (F) nucleic acids-carbohydrates regions. Line thickness is proportional to standard deviation, (Reprinted with permission from [6]. Copyright 2012 American Chemical Society).
Figure 3
Figure 3
(A) IR spectra of living leukemia cells taken in situ without the introduction of sodium arsenite (black) and after introduction of sodium arsenite for 40 min (orange), 60 min (blue), 100 min (green) and 120 min (red). The inset shows a focus on the carbonyl ester and amide region; and (B) shows second-derivatives from (A). The derivative-spectra clearly show shifts in the amide I (1600–1700 cm−1) and amide II (1500–1600 cm−1) bands between the control and arsenite-treated cells. (Reprinted with permission from [67]. Copyright 2010 Elsevier).
Figure 4
Figure 4
Visible (A) and Chemical (BF) images of different sized DRG neurons. Chemical images were generated by integrating with a baseline in the regions (B) 1605–1705 cm−1; (C) 2800–3000 cm−1; (D) 3000–3600 cm−1; (E) 1718–1765 cm−1; (F) 993–1134 cm−1; (G) and (H) show sequences of spectra taking from equally spaced points along the lines marked 1 (G) and 2 (H). The sequence proceeds along the profile, with the spectrum from the beginning of the profile at the bottom of the stack and the end of the profile at the top. The scale bar of Figure 4AF is 10 μm.
Figure 5
Figure 5
Spatial and temporal changes of lipid and protein concentrations in living M. hardyi algal cells subjected to P-starvation (A,B) and N-starvation (C,D) following nutrient resupplying. The x-axis represents position along the cell and the y-axis represents time following resupply of P (A,B) or N (C,D). (Reprinted with permission from [9]. Copyright 2006 John Wiley and Sons).
Figure 6
Figure 6
Temporally resolved series of IR images showing distributions of biochemically important functional groups and time dependent changes in the concentrations of several biochemical functional groups for a Thalassiosira weissflogii maintained in the flow cell. The images are obtained from data sets collected at 1, 3 and 8 h after exposure to medium containing a high concentration (5000 ppm) of CO2. The images are displayed on a rainbow scale, with the red corresponding to the highest detected quantity of the functional group.
Figure 7
Figure 7
(A) Time lapse sequence of spectra created from spatially averaged IR absorption spectra over the top half of the cell in Figure 6. The sequence ranges between t = 3 to 8 h. Functional groups are highlighted in the spectral stack; blue: CH3 (2890–2937 cm−1); green: CH2 (2834–2863 cm−1); purple: CO (1710–1756 cm−1) from a phospholipid or ester; red: amide II (1500–1570 cm−1); yellow: carbohydrate/silica (1016–1186 cm−1); and (B) Sequence of spectra created from the same dataset as the spectra stack in Figure 7A, spatially averaged over the bottom half of the cell.
Figure 8
Figure 8
(A) Comparison of IR absorption spectra of control (blue) and NGF-treated (red) PC12 cells; and (B,C) Time absorbance of bands in the fingerprint region from short-term (B) and long-term (C) NGF-treatments. (Reprinted with permission from [78]. Copyright 2012 American Chemical Society).
Figure 8
Figure 8
(A) Comparison of IR absorption spectra of control (blue) and NGF-treated (red) PC12 cells; and (B,C) Time absorbance of bands in the fingerprint region from short-term (B) and long-term (C) NGF-treatments. (Reprinted with permission from [78]. Copyright 2012 American Chemical Society).
Figure 9
Figure 9
Top and side views of 3D protein and lipid distributions for an embryoid body colony of stem cells. Volume renderings from reconstructions for the protein (P) amide I absorption band [1,650 cm−1; blue-red; (top)] and lipid (L)-specific bands [2,850 cm−1; orange-yellow; (side)] reveal three layers of cell bodies with inhomogeneously distributed lipids. The two spectral region reconstructions are shown independently and superimposed (P + L) to provide context for the images. Scale bar, 10 μm. (Reprinted with permission from [7]. Copyright 2012 American Chemical Society).

Similar articles

Cited by

References

    1. Martin M.C., Schade U., Lerch P., Dumas P. Recent applications and current trends in analytical chemistry using synchrotron-based Fourier-transform infrared microspectroscopy. Trends Anal. Chem. 2010;29:453–463.
    1. Hirschmugl C.J., Gough K.M. Fourier transform infrared spectrochemical imaging: Review of design and applications with a focal plane array and multiple beam synchrotron radiation source. Appl. Spectrosc. 2012;66:475–491. - PubMed
    1. Nasse M.J., Ratti S., Giordano M., Hirschmugl C.J. Demountable liquid/flow cell for in vivo infrared microspectroscopy of biological specimens. Appl. Spectrosc. 2009;63:1181–1186. - PubMed
    1. Tobin M.J., Puskar L., Hasan J., Webb H.K., Hirschmugl C.J., Nasse M.J., Gervinskas G., Juodkazis S., Watson G.S., Watson J.A., et al. High-spatial-resolution mapping of superhydro-phobic cicada wing surface chemistry using infrared microspectroscopy and infrared imaging at two synchrotron beamlines. J. Synchrot. Radiat. 2013;20:482–489. - PubMed
    1. Holman H.Y.N., Miles R., Hao Z., Wozei E., Anderson L.M., Yang H. Real-time chemical imaging of bacterial activity in biofilms using open-channel microfluidics and synchrotron FTIR spectromicroscopy. Anal. Chem. 2009;81:8564–8570. - PubMed

MeSH terms

Substances

LinkOut - more resources