. 2014 Feb;88(3):1636-51.
doi: 10.1128/JVI.02851-13. Epub 2013 Nov 20.

Highly pathological influenza A virus infection is associated with augmented expression of PD-1 by functionally compromised virus-specific CD8+ T cells

Affiliations

Highly pathological influenza A virus infection is associated with augmented expression of PD-1 by functionally compromised virus-specific CD8+ T cells

John A Rutigliano et al. J Virol. 2014 Feb.

Abstract

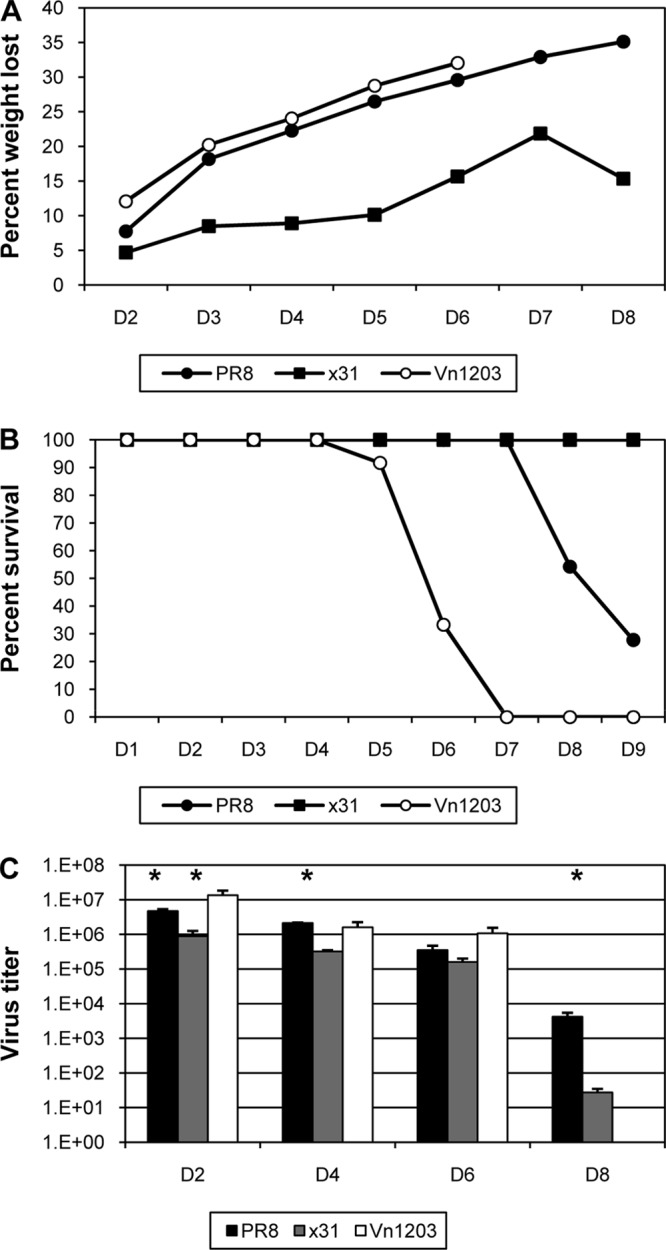
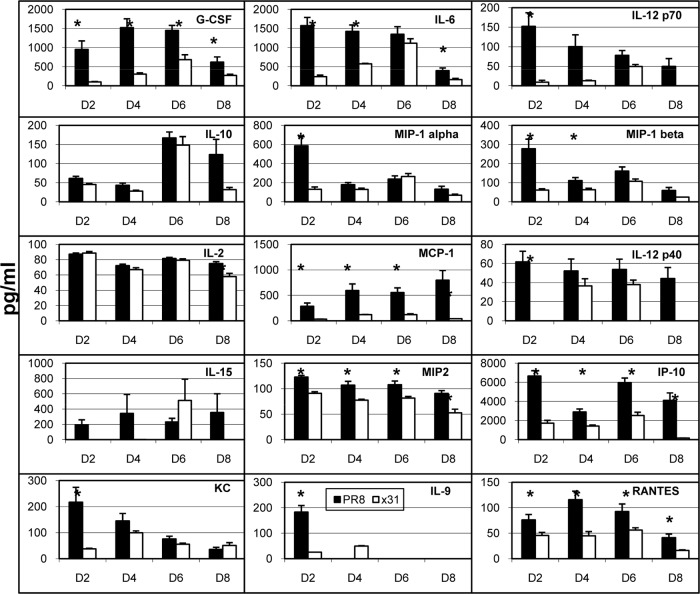
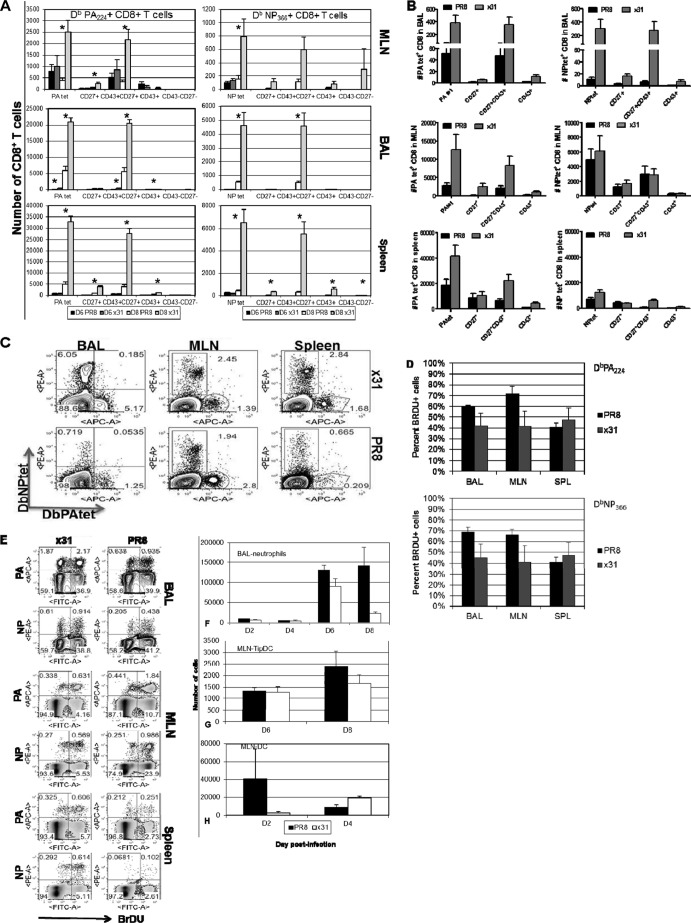
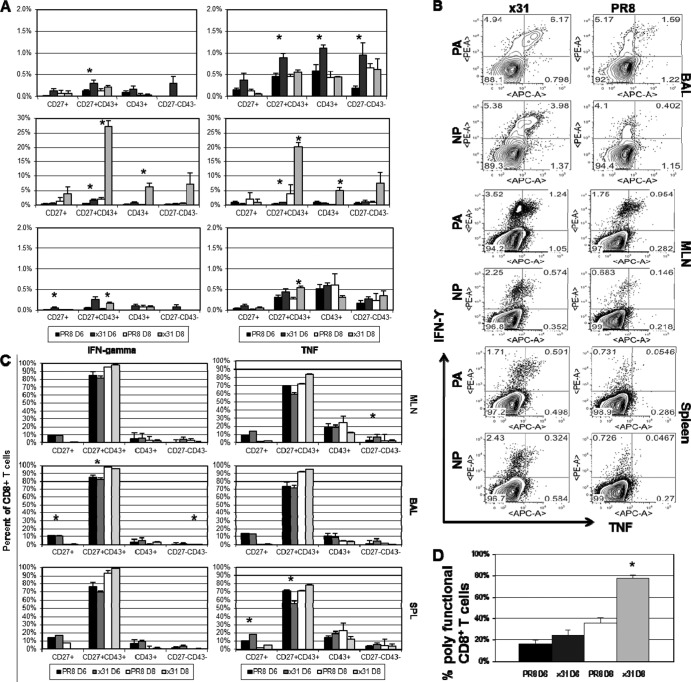
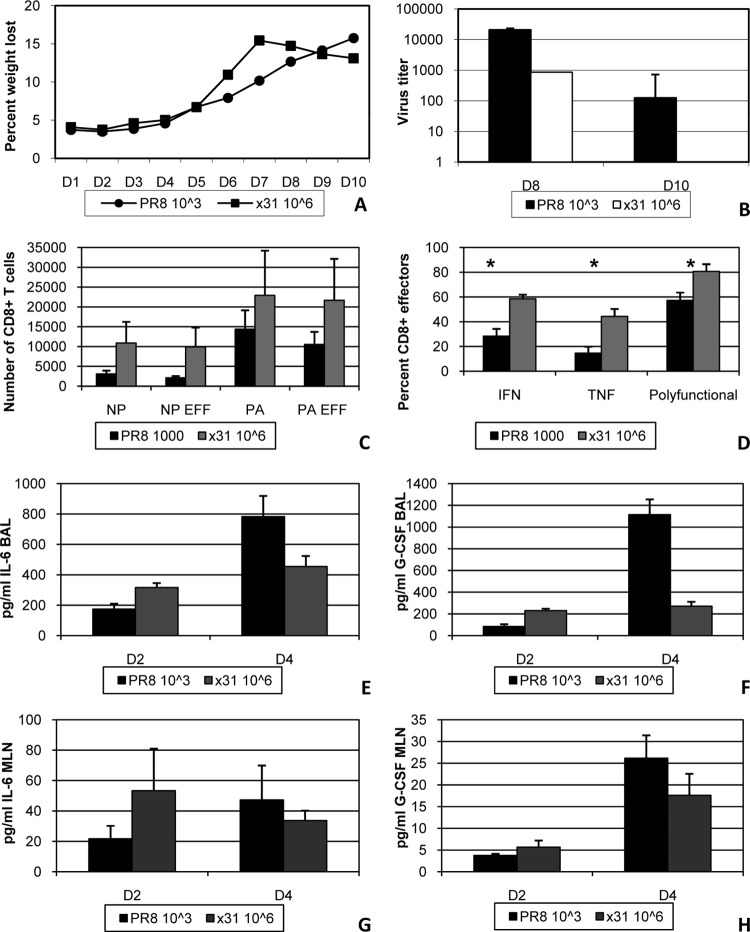
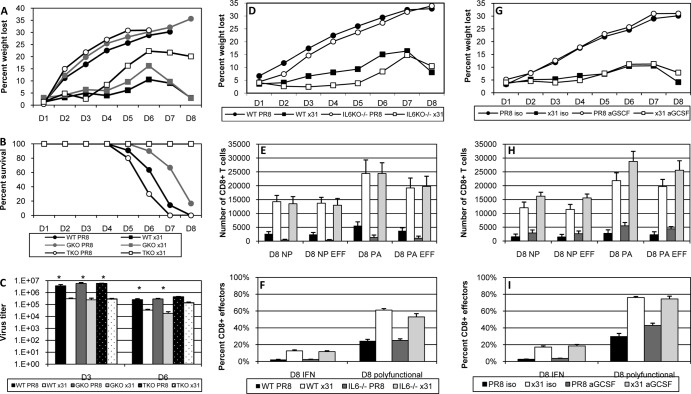
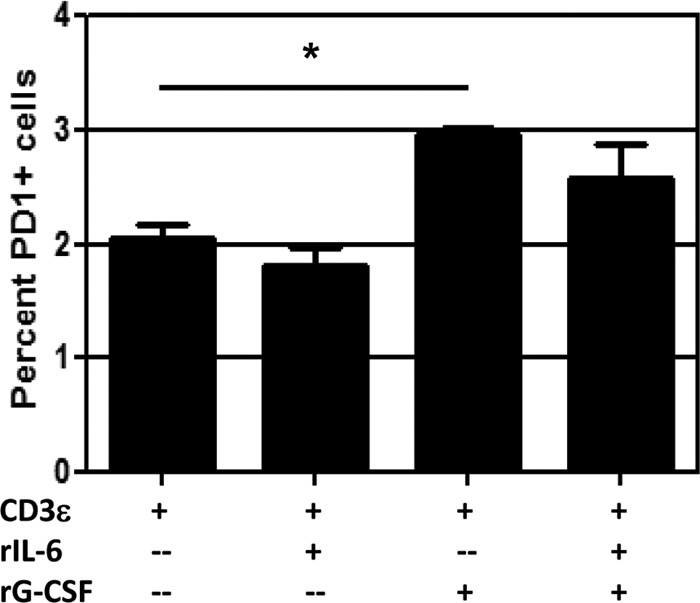
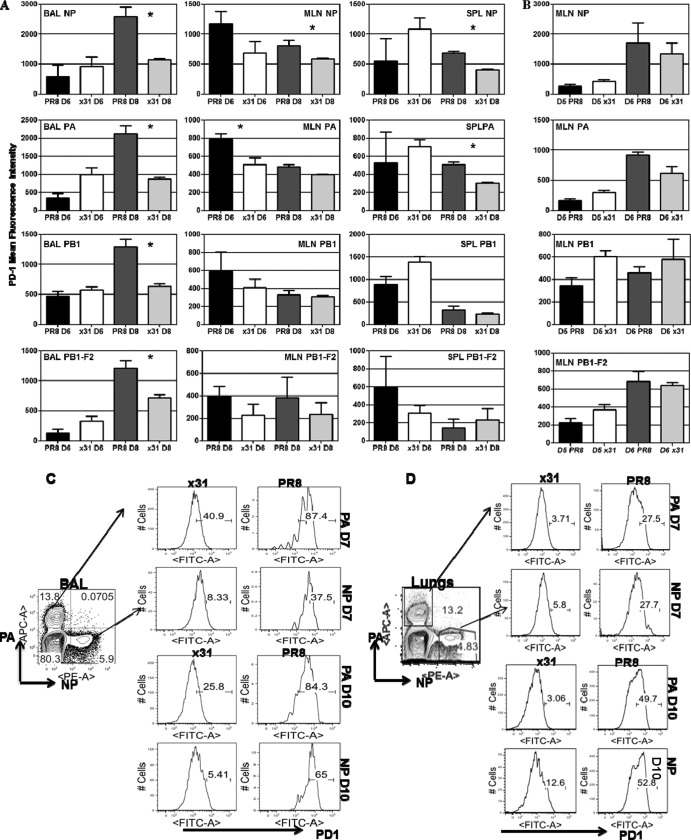
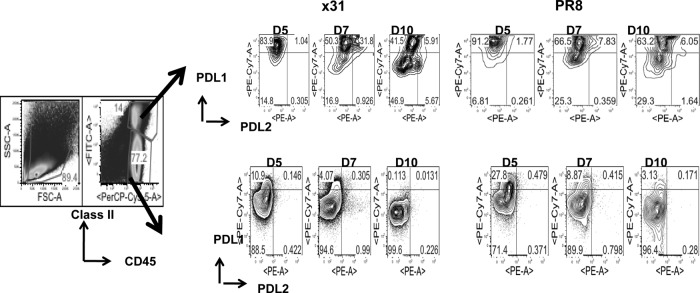
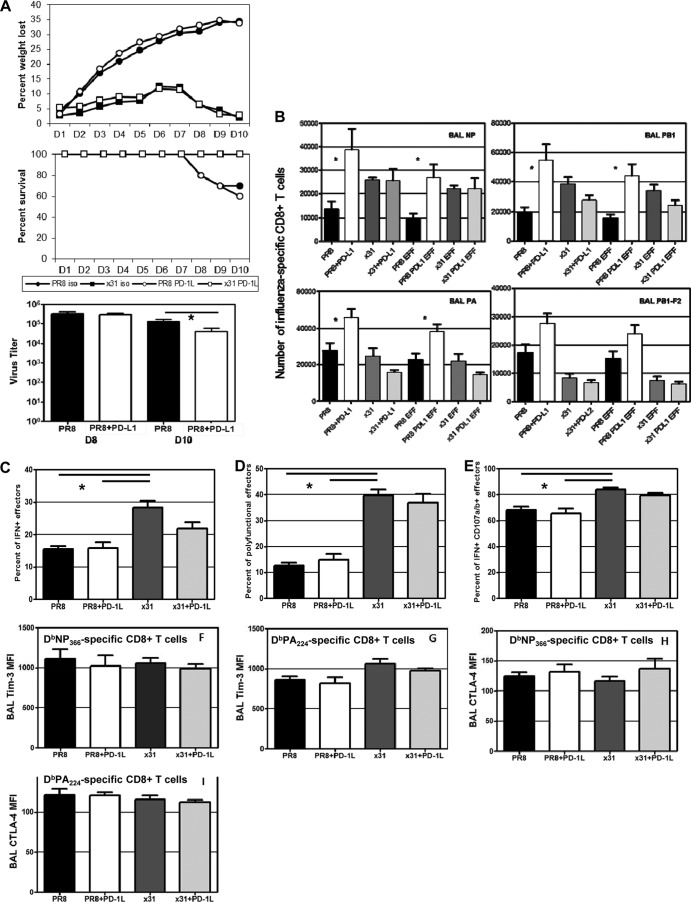
One question that continues to challenge influenza A research is why some strains of virus are so devastating compared to their more mild counterparts. We approached this question from an immunological perspective, investigating the CD8(+) T cell response in a mouse model system comparing high- and low-pathological influenza virus infections. Our findings reveal that the early (day 0 to 5) viral titer was not the determining factor in the outcome of disease. Instead, increased numbers of antigen-specific CD8(+) T cells and elevated effector function on a per-cell basis were found in the low-pathological infection and correlated with reduced illness and later-time-point (day 6 to 10) viral titer. High-pathological infection was associated with increased PD-1 expression on influenza virus-specific CD8(+) T cells, and blockade of PD-L1 in vivo led to reduced virus titers and increased CD8(+) T cell numbers in high- but not low-pathological infection, though T cell functionality was not restored. These data show that high-pathological acute influenza virus infection is associated with a dysregulated CD8(+) T cell response, which is likely caused by the more highly inflamed airway microenvironment during the early days of infection. Therapeutic approaches specifically aimed at modulating innate airway inflammation may therefore promote efficient CD8(+) T cell activity. We show that during a severe influenza virus infection, one type of immune cell, the CD8 T cell, is less abundant and less functional than in a more mild infection. This dysregulated T cell phenotype correlates with a lower rate of virus clearance in the severe infection and is partially regulated by the expression of a suppressive coreceptor called PD-1. Treatment with an antibody that blocks PD-1 improves T cell functionality and increases virus clearance.


Figures

FIG 1
FIG 1
Clinical profiles of high- and low-path influenza A virus infection. Mice were infected i.n. with 104 EID50 of the PR8, x31, or ΔVn1203 influenza A virus, and illness (A), survival (B), and virus titers (C) were measured at intervals. Panels A and C show results from a representative of five experiments (n = 4 or 5 mice per group). Panel B shows survival from four combined experiments using between 20 (ΔVn1203) and 55 total mice per group. *, P < 0.05 for comparisons between PR8 and x31 at days 2, 4, and 8 and between x31 and ΔVn1203 on day 2.
FIG 2
FIG 2
Cytokine and chemokine production in the airway microenvironment after influenza virus infection. Mice were infected as described for Fig. 1. At days 2, 4, 6, and 8 after infection, BAL fluid wash supernatants were collected and analyzed by multiplex cytokine bead analysis. The data set shows cytokines and chemokines that were consistently measured above the limit of detection across multiple experiments. The data show results from a representative experiment of five with 4 or 5 mice per group. *, P < 0.05 for comparisons between PR8 and x31 at each time point.
FIG 3
FIG 3
Influenza virus-specific effector CD8+ T cells are more numerous in low-path infection. (A and B) Mice were infected as for Fig. 1, and tetramer staining was used to enumerate influenza virus-specific DbPA224+ and DbNP366+ CD8+ T cells in the BAL fluid, MLN, and spleen at days 6 and 8 postinfection (A), as well as at day 7 (B). After gating on tetramer-positive cells, expression of CD27 and CD43 was examined, and each subpopulation is shown to the right of the tetramer-positive bars. (C) Representative dot plots of the data from panel B. (D) Proliferation of DbPA224+ and DbNP366+ CD8+ T cells in the BAL fluid, MLN, and spleen at day 7 was measured by incorporation of BrdU. (E) Representative dot plots for panel D. (F) Neutrophils were isolated by gating on CD11b+ CD11c cells and then counting MHCII GR1+ cells. (G) TipDCs were identified as MCHII+ GR1high cells. (H) Classical DCs in the MLN were identified by gating on CD11b+ CD11c cells and then counting MHCII+ GR1 cells. The data are from a single representative of more than five experiments with 4 or 5 mice per group. *, P < 0.05.
FIG 4
FIG 4
Activated influenza virus-specific CD8+ T cells are almost uniformly CD27+ CD43+ effectors. (A) Peptide-induced cytokine production profiles for the different IFN-γ+ and/or TNF+ CD27/CD43 subsets shown in Fig. 3. Cells were first gated on CD27/CD43 subsets, and the proportion making IFN-γ or TNF was calculated. (B) Representative dot plots of antiviral cytokine production by DbPA224+ and DbNP366+ CD8+ T cells at day 7 postinfection are shown to confirm that the responses seen at day 8 are under way at day 7. These plots are from the same experiments shown in Fig. 3D and E. (C) Cells isolated from the mice sampled for Fig. 3 were assayed for IFN-γ and TNF production by ICS. Cells were analyzed by gating first on the cytokine-positive CD8+ sets followed by CD27 and CD43 staining. (D) The percentage of CD8+ IFN-γ+ TNF+ cells was then divided by the percentage of CD8+ IFN-γ+ cells to give the percentage of polyfunctional (IFN-γ+ TNF+) cells within the IFN-γ+ set. The data show results from a representative experiment of five with 4 or 5 mice per group. *, P < 0.05.
FIG 5
FIG 5
Equalizing the illness outcome does not alter the CD8+ T cell response to high- and low-path influenza virus infection. (A to D) Mice were infected i.n. with 103 EID50 of PR8 or 106 EID50 of x31 to monitor illness by daily weight change (A) and viral titer (B) and for the analysis of BAL fluid populations taken on day 8 for tetramer-positive CD8+ CTL numbers (C) and functional activation (D). EFF, tetramer-positive CD27+ CD43+. (E to H) Multiplex cytokine bead analysis was used to assess the concentrations of IL-6 and G-CSF in supernatants from the BAL fluid (E and F) and MLN (G and H) at days 2 and 4 postinfection. The data are from a representative experiment of three with 4 or 5 mice per group. *, P < 0.05.
FIG 6
FIG 6
High- and low-path infection in IFN-γ−/−, TNF−/−, IL-6−/−, and anti-G-CSF-treated mice. (A to C) WT B6, IFN-γ−/−, and TNF−/− mice were infected i.n. with 104 EID50 of PR8 or x31 to determine illness (A), survival (B), and lung virus titers (C) on days 3 and 6. (D to F) WT B6 or IL-6−/− mice were infected i.n. with 104 EID50 of PR8 or x31. (G to I) In separate experiments, WT B6 mice were treated with 200 μg anti-G-CSF antibody or isotype control on days 1, 3, and 5. (D and G) Mice were weighed daily to monitor illness. (E and H) Tetramer-positive CD8+ CTLs were enumerated on day 8, and the numbers of influenza virus-specific CD27+ CD43+ effector CD8+ T cells were also calculated. (F and I) ICS was used to measure the percentage of CD27 CD43+ effector CD8+ T cells that were producing IFN-γ and also to measure polyfunctionality. The data show results from a representative experiment of three (A to F) or two (G to I) with 4 or 5 mice per group. *, P < 0.05 for all comparisons between PR8-infected groups and their x31-infected counterparts in panels E, F, H, and I.
FIG 7
FIG 7
G-CSF induces PD-1 expression on activated CD8+ T cells in vitro. CD8+ T cells were isolated from spleens of naive WT mice and cultured in 96-well plates precoated with 4 μg/ml anti-mouse CD3 and 1 μg/ml anti-mouse CD28 and rhIL-2. Triplicate wells were supplemented with 5 ng/ml recombinant mouse IL-6 or G-CSF as indicated. After 72 h, cells were treated with brefeldin A for 4 h, followed by intracellular cytokine staining for IFN-γ to confirm that cells had been activated (not shown). Surface staining for PD-1 is shown. The data are from a single representative of more than five experiments. *, = P < 0.05 for comparison between CD3ε alone and CD3ε plus rG-CSF.
FIG 8
FIG 8
PD-1 expression is upregulated on effector CD8+ T cells in the BAL fluid after high-path infection. Mice were infected as described for Fig. 1. (A) At days 6 and 8 postinfection, cells isolated from the BAL fluid, MLN, and spleen were assessed by flow cytometry. Influenza virus-specific CD8+ T cells were identified by tetramer staining for all 4 epitopes recognized during primary infection. PD-1 expression on tetramer-positive/CD8+ T cells was measured by mean fluorescence intensity. (B) PD-1 expression in the MLN at days 5 and 6 in a separate experiment to assess the likelihood of exhaustion occurring in the MLN before CD8+ T cells migrated into the airway. (C and D) Representative dot plots and histograms illustrating the percentages of DbPA224+ and DbNP366+ CD8+ T cells that express PD-1 at days 7 and 10 in the BAL fluid (C) and lung (D). The data are a single representative of more than five experiments with 4 or 5 mice per group. *, P < 0.05.
FIG 9
FIG 9
PD-L1 expression is upregulated on target cells during high-path infection. Mice were infected with 104 EID50 of PR8 or x31 and sacrificed at days 5, 7, and 10 to assess expression of PD-L1 and PD-L2 on cells targeted by CD8+ T cells in the BAL fluid. Target cells were defined by expression of class II MHC, and CD45.2 PD-L1 and PD-L2 expression was examined after gating on CD45+ class II MHC+ and CD45+ class II MHC cells. The data show dot plots from a representative experiment of two with 4 or 5 mice per group.
FIG 10
FIG 10
Administration of anti-PD-L1 rescues CD8+ T cell numbers but not functionality or illness. Mice infected i.n. with a dose of 104 EID50 of PR8 or x31 were treated with 200 μg anti-PD-L1 antibody or isotype control antibody starting the day before infection and continuing every other day thereafter. (A) Illness and survival were assessed daily. Viral titers were measured by plaque assay at the indicated days. (B) Tetramer-positive CD8+ T cells in the BAL fluid at day 8 postinfection (left graphs). After gating on tetramer-positive populations, activation phenotypes were measured, and the number of CD27+ CD43+ influenza virus-specific CD8+ T cells was calculated (EFF) (right graphs). (C to E) Activation and effector function was measured by ICS after ex vivo stimulation with PA224 and NP366 peptides. The percentages of IFN-γ+ effectors (C) and polyfunctional effectors (D) were determined as described for Fig. 5. (E) The percentage of CD107a/b+ effectors was determined by calculating the percentage of effectors that were IFN-γ+/CD107a/b+ and dividing that percentage by the total percentage of IFN-γ+ effectors. (F to I) Cells from the mice used for Fig. 7 and 8 were also assayed for Tim-3 (F and G) and CTLA-4 (H and I) expression by flow cytometry. The day 8 BAL fluid CTLs were analyzed by MFI for Tim-3 and CTLA-4 staining of tetramer-positive CD8+ TLs. The data show a representative experiment of two with 4 or 5 mice per group. *, P < 0.05.

Similar articles

Cited by

References

    1. Moskophidis D, Kioussis D. 1998. Contribution of virus-specific CD8+ cytotoxic T cells to virus clearance or pathologic manifestations of influenza virus infection in a T cell receptor transgenic mouse model. J. Exp. Med. 188:223–232. 10.1084/jem.188.2.223 - DOI - PMC - PubMed
    1. Thomas PG, Keating R, Hulse-Post DJ, Doherty PC. 2006. Cell-mediated protection in influenza infection. Emerg. Infect. Dis. 12:48–54. 10.3201/eid1201.051237 - DOI - PMC - PubMed
    1. Valkenburg SA, Rutigliano JA, Ellebedy AH, Doherty PC, Thomas PG, Kedzierska K. 2011. Immunity to seasonal and pandemic influenza A viruses. Microbes Infect. Inst. Pasteur 13:489–501. 10.1016/j.micinf.2011.01.007 - DOI - PMC - PubMed
    1. Kim TS, Sun J, Braciale TJ. 2011. T cell responses during influenza infection: getting and keeping control. Trends Immunol. 32:225–231. 10.1016/j.it.2011.02.006 - DOI - PMC - PubMed
    1. Sanders CJ, Doherty PC, Thomas PG. 2011. Respiratory epithelial cells in innate immunity to influenza virus infection. Cell Tissue Res. 343:13–21. 10.1007/s00441-010-1043-z - DOI - PubMed

Publication types

Substances