Relationship between regional spending on vascular care and amputation rate
- PMID: 24258010
- PMCID: PMC4279246
- DOI: 10.1001/jamasurg.2013.4277
Relationship between regional spending on vascular care and amputation rate
Abstract
Importance: Although lower extremity revascularization is effective in preventing amputation, the relationship between spending on vascular care and regional amputation rates remains unclear.
Objective: To test the hypothesis that higher regional spending on vascular care is associated with lower amputation rates for patients with severe peripheral arterial disease.
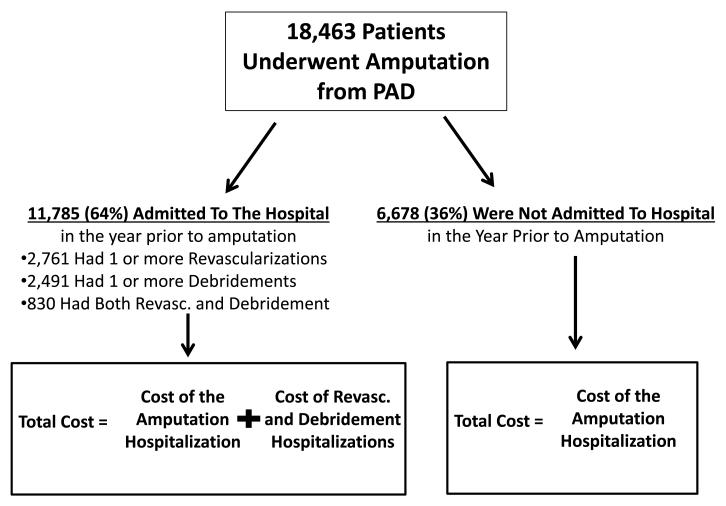
Design, setting, and participants: Retrospective cohort study of 18,463 US Medicare patients who underwent a major peripheral arterial disease-related amputation during the period between 2003 and 2010.
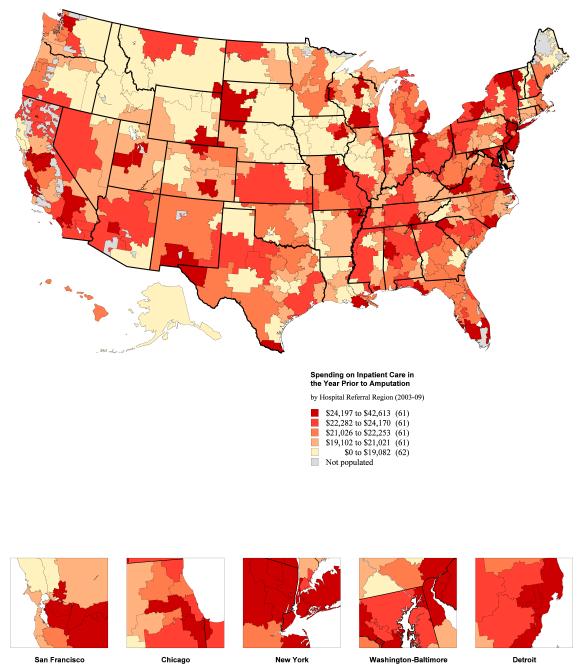
Exposure: Price-adjusted Medicare spending on revascularization procedures and related vascular care in the year before lower extremity amputation, across hospital referral regions.
Main outcomes and measures: Correlation coefficient between regional spending on vascular care and regional rates of peripheral arterial disease-related amputation.
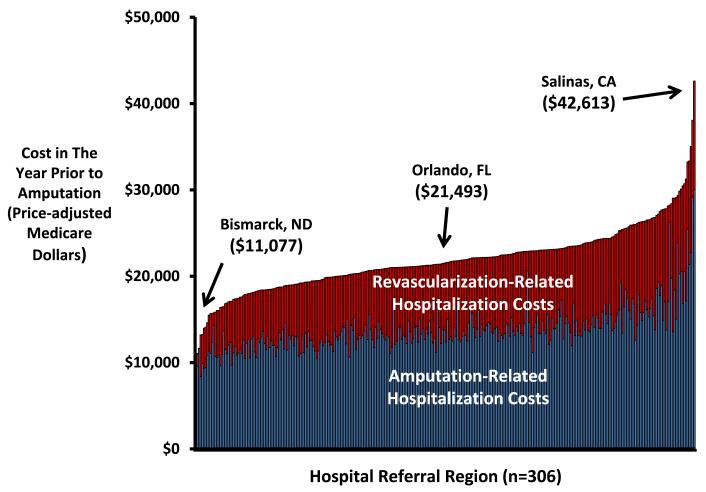
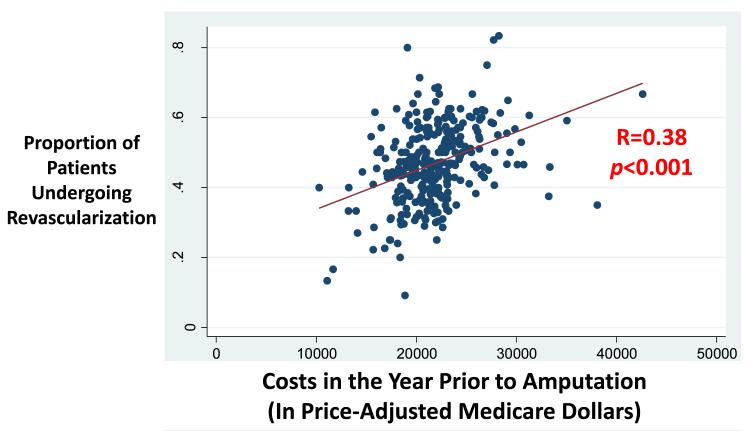
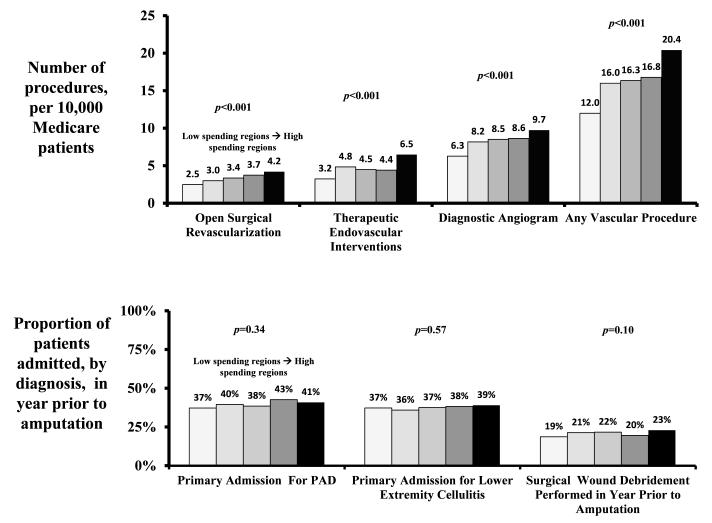
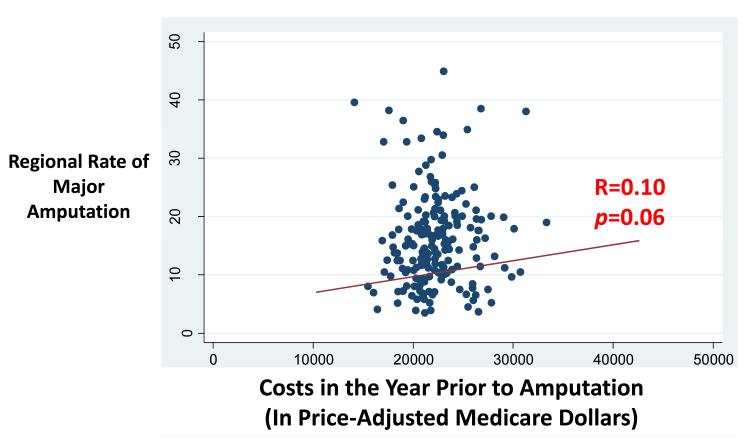
Results: Among patients who ultimately underwent an amputation, 64% were admitted to the hospital in the year prior to the amputation for revascularization, wound-related care, or both; 36% were admitted only for their amputation. The mean cost of inpatient care in the year before amputation, including costs related to the amputation procedure itself, was $22,405, but it varied from $11,077 (Bismarck, North Dakota) to $42,613 (Salinas, California) (P < .001). Patients in high-spending regions were more likely to undergo vascular procedures as determined by crude analyses (12.0 procedures per 10,000 patients in the lowest quintile of spending and 20.4 procedures per 10,000 patients in the highest quintile of spending; P < .001) and by risk-adjusted analyses (adjusted odds ratio for receiving a vascular procedure in highest quintile of spending, 3.5 [95% CI, 3.2-3.8]; P < .001). Although revascularization was associated with higher spending (R = 0.38, P < .001), higher spending was not associated with lower regional amputation rates (R = 0.10, P = .06). The regions that were most aggressive in the use of endovascular interventions were the regions that were most likely to have high spending (R = 0.42, P = .002) and high amputation rates (R = 0.40, P = .004).
Conclusions and relevance: Regions that spend the most on vascular care perform the most procedures, especially endovascular interventions, in the year before amputation. However, there is little evidence that higher regional spending is associated with lower amputation rates. This suggests an opportunity to limit costs in vascular care without compromising quality.
Figures
References
-
- Peacock JM, Keo HH, Yu X, Oldeberg N, Duval S, Henry TD, Jaff MR, Baumgartner I, Hirsch AT. Abstract 5788: The incidence and health economic burden of critical limb ischemia and ischemic amputation in minnesota: 2005-2007. Circulation. 2009;120:S1148.
-
- Goodney PP, Beck AW, Nagle J, Welch HG, Zwolak RM. National trends in lower extremity bypass surgery, endovascular interventions, and major amputations. Journal of Vascular Surgery. 2009;50:54–60. - PubMed
Publication types
MeSH terms
Grants and funding
LinkOut - more resources
Full Text Sources
Other Literature Sources