. 2014 Jan;25(2):302-17.
doi: 10.1091/mbc.E13-01-0020. Epub 2013 Nov 20.

Smc5/6-mediated regulation of replication progression contributes to chromosome assembly during mitosis in human cells

Affiliations

Smc5/6-mediated regulation of replication progression contributes to chromosome assembly during mitosis in human cells

Lina Marcela Gallego-Paez et al. Mol Biol Cell. 2014 Jan.

Abstract

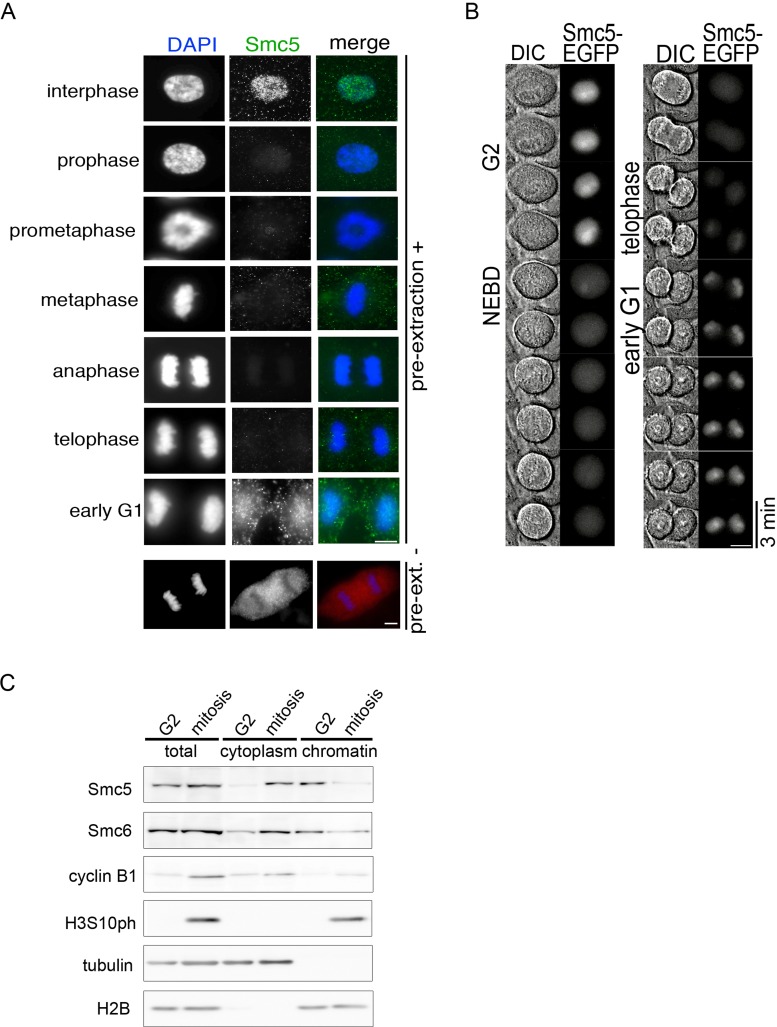
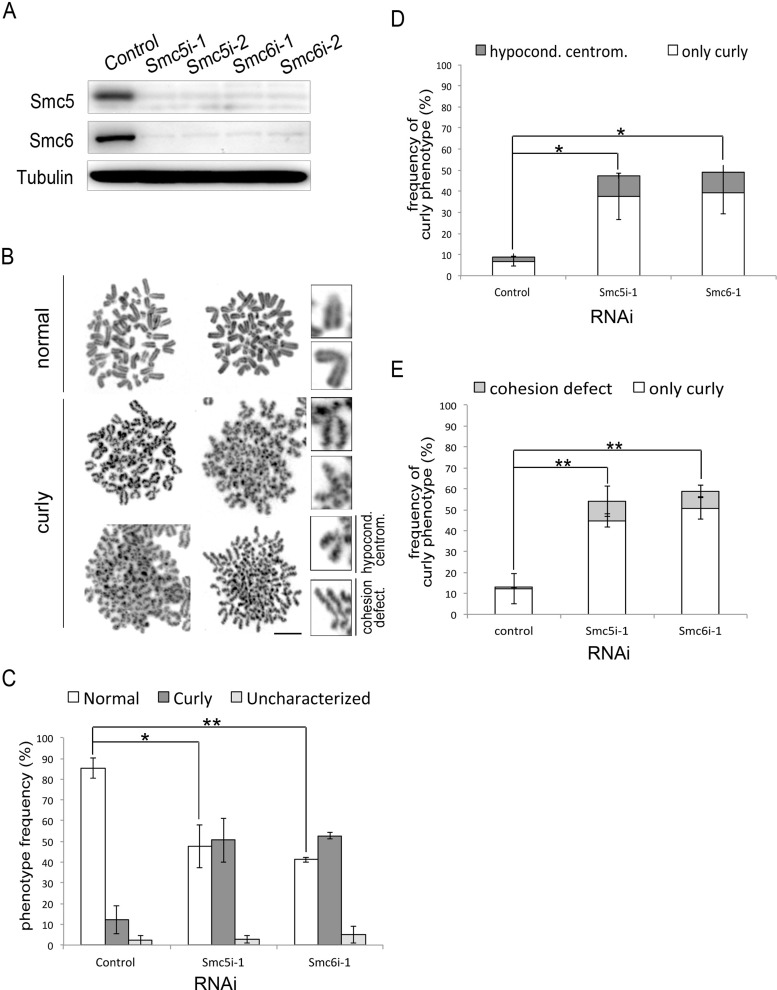
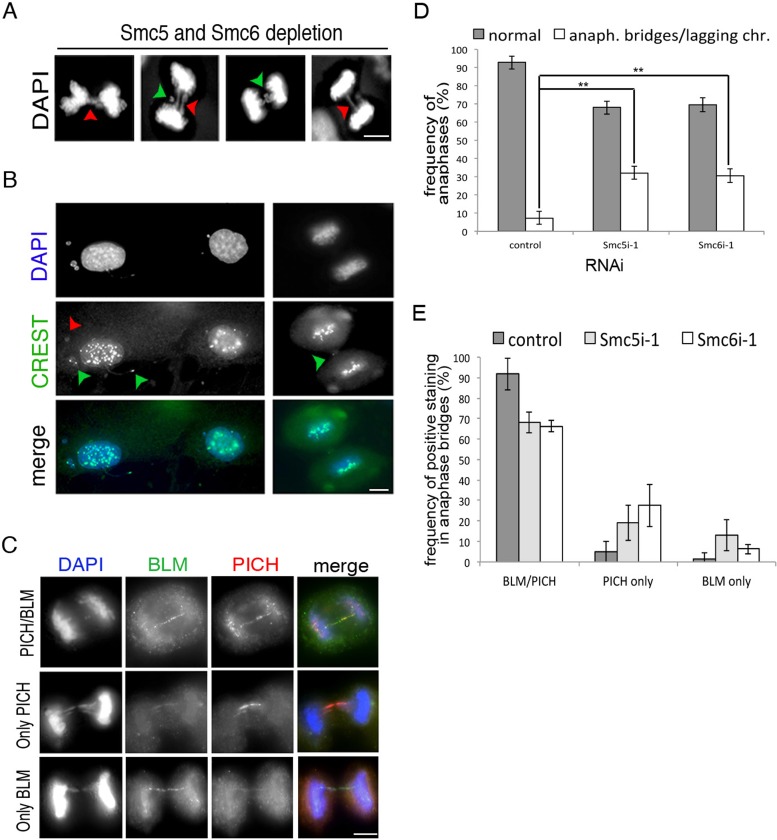
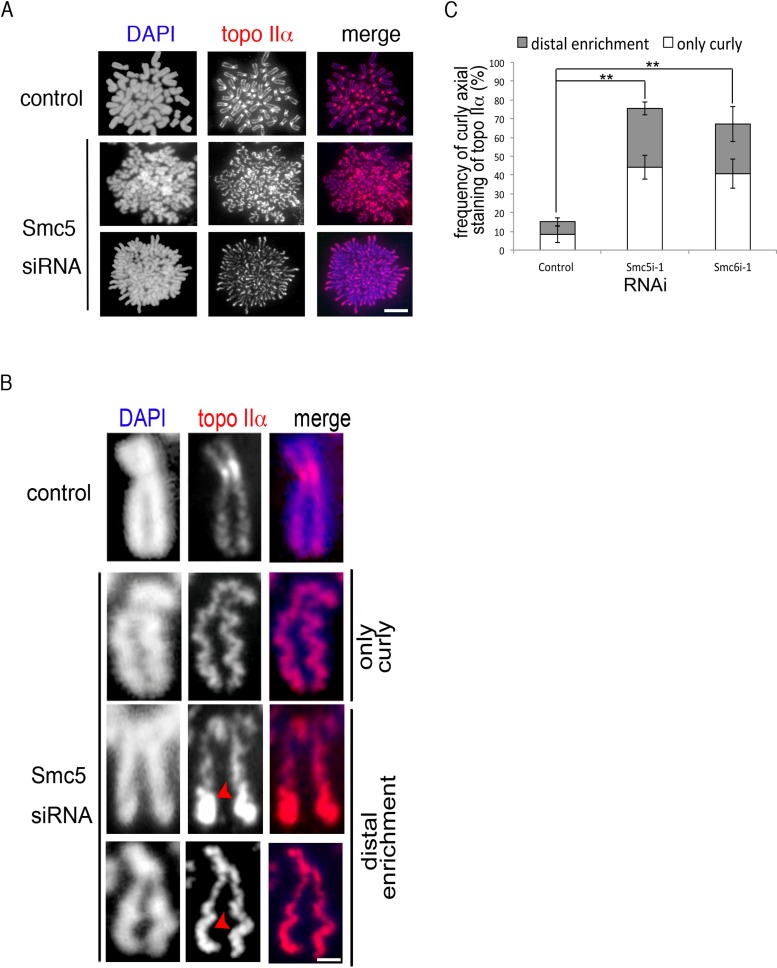
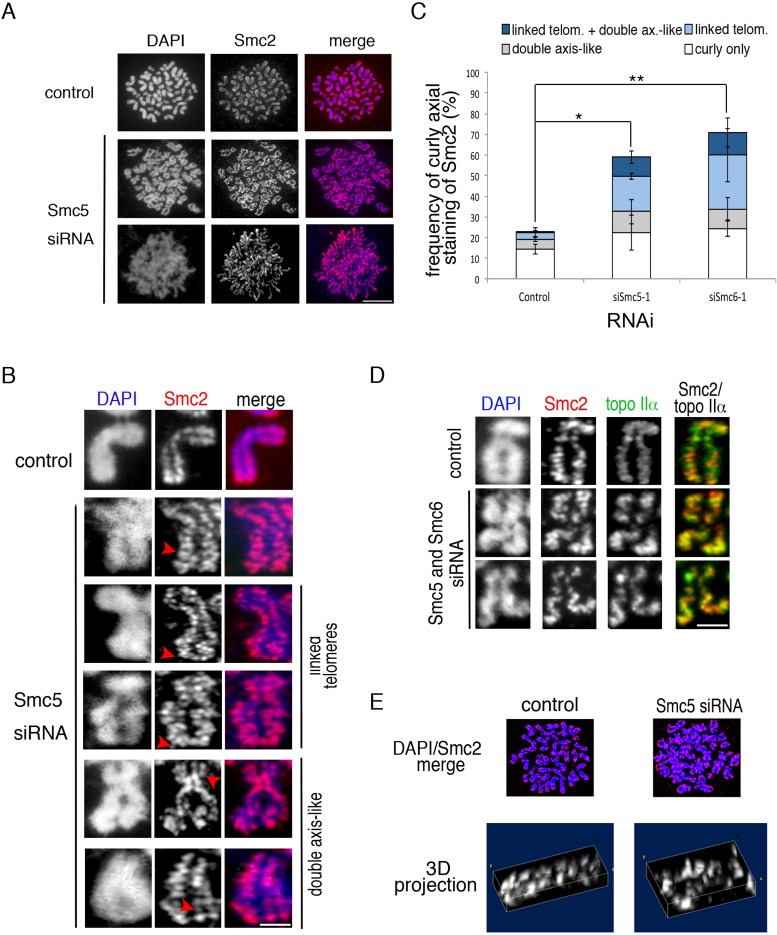
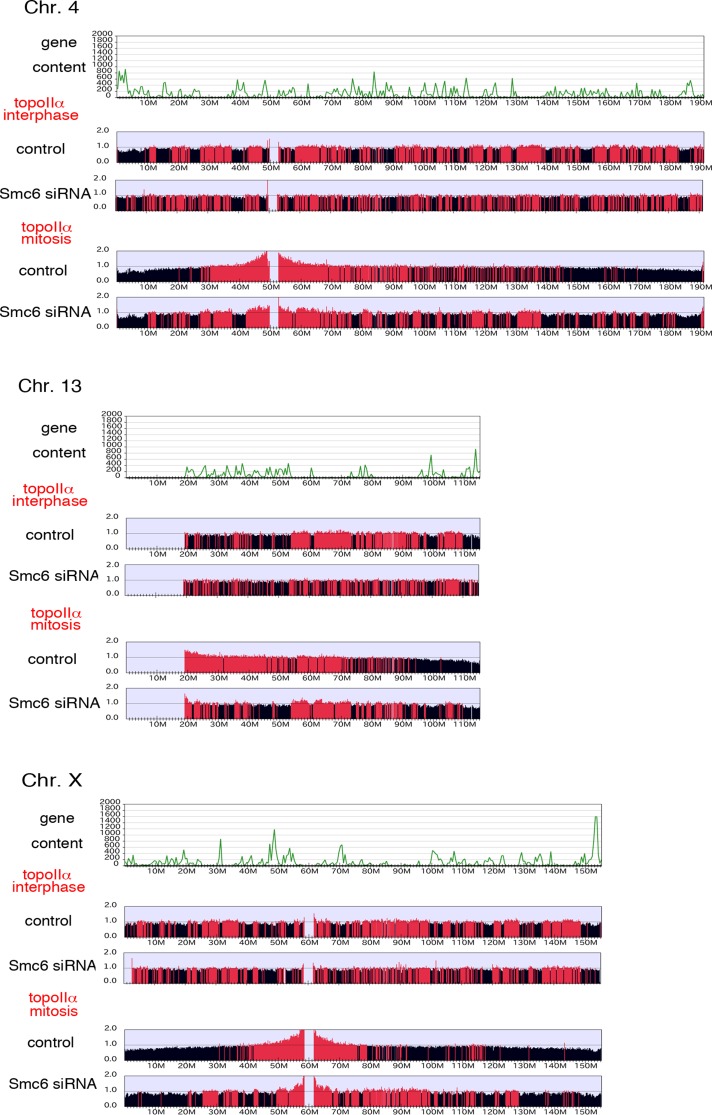
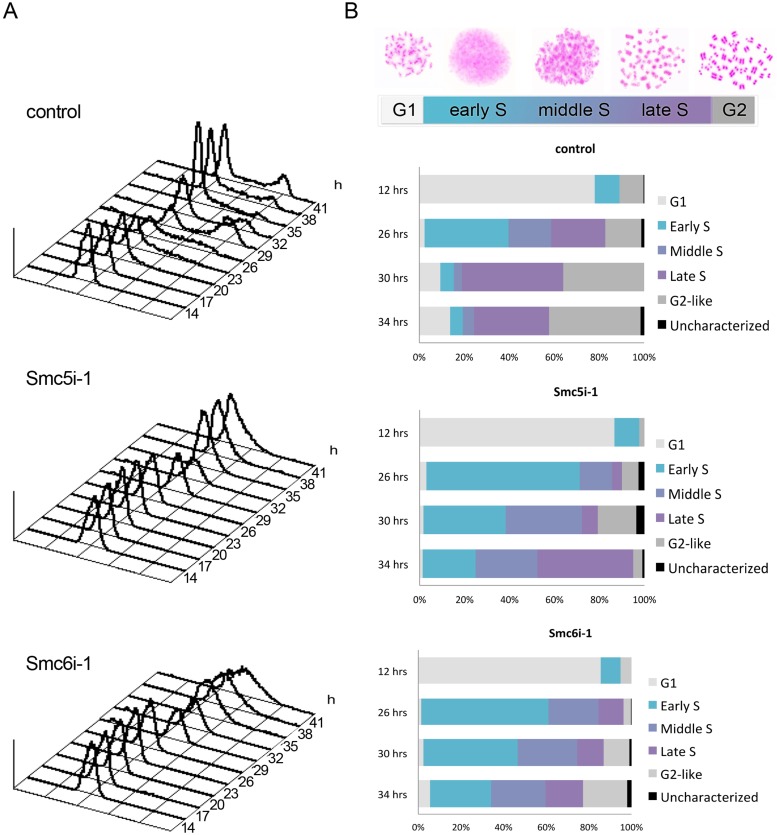
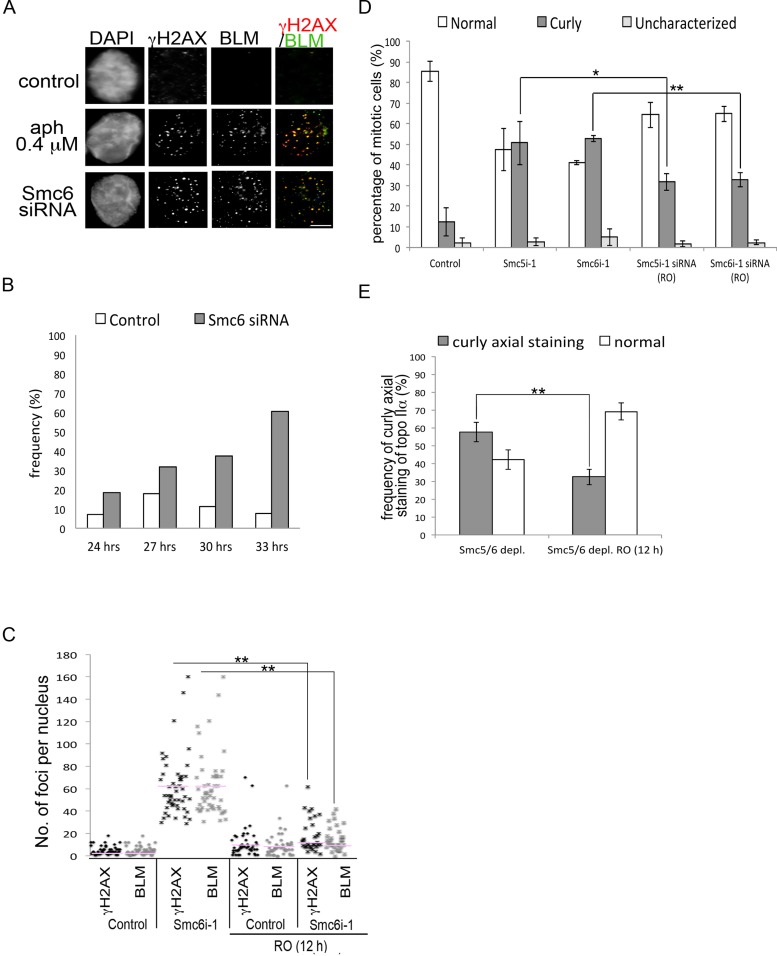
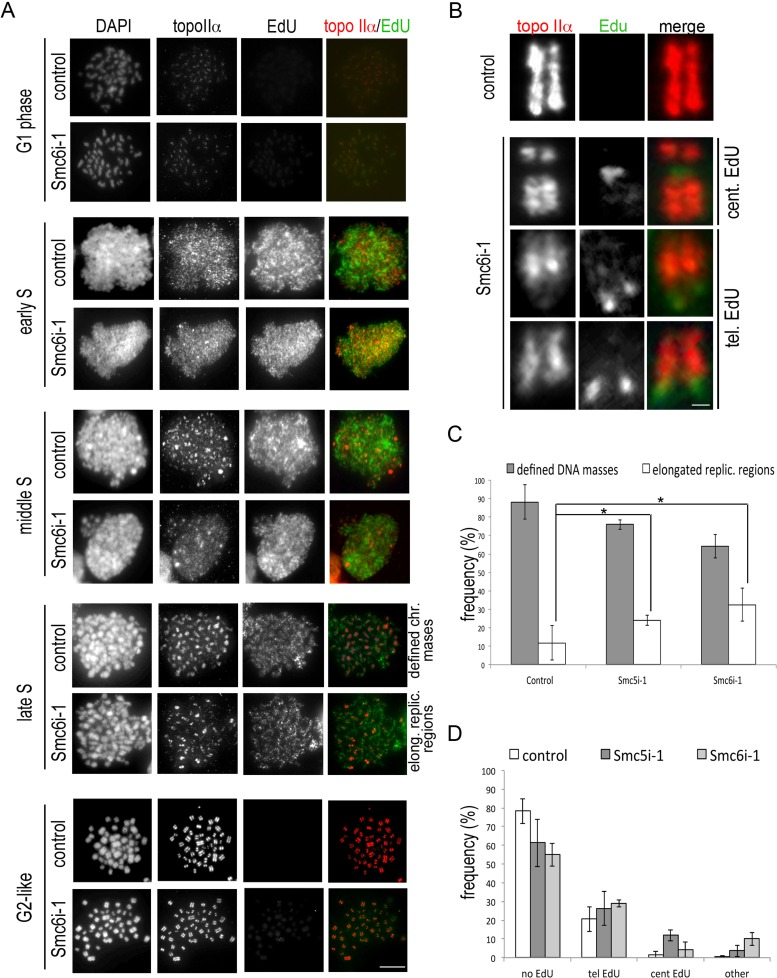
The structural maintenance of chromosomes (SMC) proteins constitute the core of critical complexes involved in structural organization of chromosomes. In yeast, the Smc5/6 complex is known to mediate repair of DNA breaks and replication of repetitive genomic regions, including ribosomal DNA loci and telomeres. In mammalian cells, which have diverse genome structure and scale from yeast, the Smc5/6 complex has also been implicated in DNA damage response, but its further function in unchallenged conditions remains elusive. In this study, we addressed the behavior and function of Smc5/6 during the cell cycle. Chromatin fractionation, immunofluorescence, and live-cell imaging analyses indicated that Smc5/6 associates with chromatin during interphase but largely dissociates from chromosomes when they condense in mitosis. Depletion of Smc5 and Smc6 resulted in aberrant mitotic chromosome phenotypes that were accompanied by the abnormal distribution of topoisomerase IIα (topo IIα) and condensins and by chromosome segregation errors. Importantly, interphase chromatin structure indicated by the premature chromosome condensation assay suggested that Smc5/6 is required for the on-time progression of DNA replication and subsequent binding of topo IIα on replicated chromatids. These results indicate an essential role of the Smc5/6 complex in processing DNA replication, which becomes indispensable for proper sister chromatid assembly in mitosis.


Figures

FIGURE 1:
FIGURE 1:
Chromatin association of the Smc5/6 complex during the cell cycle. (A) RPE-1 cells with or without preextraction with 0.2% PBS/Triton X-100 were fixed in paraformaldehyde and stained with Smc5 antibody. DNA was stained with DAPI. Merged images contain Smc5 (green) and DAPI staining (blue). Scale bar: 10 μm. (B) Cell cycle behavior of Smc5 analyzed by live-cell imaging. Time-lapse images of HeLa cells stably expressing EGFP-Smc5 were acquired at 3-min intervals. Fluorescence and differential interference contrast images are shown for each time point. NEBD indicates nuclear envelope breakdown. Scale bar: 10 μm. (C) RPE-1 cells arrested at G2 by treatment with RO-3306 and cells enriched in mitosis by STLC treatment after release from G2 arrest were subjected to chromatin fractionation and immunoblotting. Relative intensity of Smc5 and Smc6 bands indicated in total and cytoplasmic fractions and in chromatin fractions were normalized by tubulin and histone H2B levels, respectively. Expression of cyclin B1 and phosphorylation of H3 (H3S10ph) were used as markers for mitosis.
FIGURE 2:
FIGURE 2:
RNAi-mediated depletion of Smc5 and Smc6 in RPE-1 cells. (A) Logarithmically proliferating RPE-1 cells were transfected with the indicated siRNA, and WCE were analyzed by immunoblotting 72 h after the transfection. Tubulin staining was shown as a loading control. Note that Smc6 becomes unstable in Smc5-depleted cells, and vice versa. (B) RPE-1 cells transfected with siRNAs against Smc5 or Smc6 were synchronized by serum starvation for 144 h, allowed to recover in serum-containing medium, and then treated with STLC to induce arrest in mitosis. Cells were harvested, and Giemsa-stained chromosome spreads were prepared. Scale bar: 10 μm. (C) Incidence of mitotic cells with curly chromosomes in cells transfected with indicated siRNAs. (D and E) Additional defects observed within the curly chromosomes in cells depleted of Smc5 or Smc6. Proportion of cells with hypercondensation of distal arms (D) and those with cohesion defect (E) are shown in the histogram. For (C–E), 300 cells per indicated condition were examined. Bar graph shows mean ± SD from three independent experiments; p value < 0.05; *, p = 0.01–0.05; **, p = 0.001–0.01; two-tailed Student's t test.
FIGURE 3:
FIGURE 3:
Depletion of Smc5 or Smc6 disrupts chromosome segregation. (A) Example images of the anaphase bridges (red arrowheads) and lagging chromosomes (green arrowheads) frequently seen in Smc5/6-depleted cells. Scale bar: 10 μm. (B) Examples of the formation of micronuclei in Smc5- and Smc6-depleted cells. Green arrows indicate micronuclei containing the centromere marker CREST; red arrows indicate micronuclei negative for the CREST signal. Scale bar: 10 μm. (C) Representative images of PICH (red) and BLM (green) immunofluorescence in anaphase bridges. DNA was counterstained with DAPI (blue). Scale bar: 10 μm. (D) Frequency of anaphase bridges and lagging chromosomes within the anaphase chromosomes observed in the control and siRNA-treated cells. Three hundred anaphases were analyzed per condition. Bar graph shows mean ± SD from three independent experiments; p value < 0.05; **, p = 0.001–0.01; two-tailed Student's t test. (E) Frequency of anaphase bridges positive for PICH and BLM, PICH only, or BLM only. One hundred anaphase bridges were analyzed for each sample.
FIGURE 4:
FIGURE 4:
Chromosome axis deformation in Smc5/6-depleted cells. (A) RPE-1 metaphase cells transfected with siRNAs against Smc5 or Smc6 or a control mock were subjected to hypotonic treatment, fixation, and staining for DNA (DAPI) and topo IIα. Right panels show the merged images of DAPI (blue) and topo IIα (red). Scale bar: 5 μm. (B) Examples of individual chromosome morphologies observed in control and Smc5-depleted cells. In merged images in the right panels, DAPI staining is shown in blue and topo IIα in red. Red arrowheads point to the defects mentioned. Scale bar: 1 μm. (C) Frequency of curly axial staining of topo IIα with or without enrichment at distal chromosome regions. Three hundred metaphases were analyzed for each sample. Bar graph shows mean ± SD from three independent experiments; p value < 0.05; **, p = 0.001–0.01; two-tailed Student's t test.
FIGURE 5:
FIGURE 5:
(A) Metaphase chromosome spreads were prepared from control and Smc5-depleted cells and stained with DAPI (blue) and anti-Smc2 (red). Scale bar: 5 μm. (B) Images of individual chromosomes showing the linked telomeres and “double axis–like” staining observed in the Smc5/6-depleted cells. Smc2 staining is in red, and DAPI in blue. Scale bar: 1 μm. (C) Frequency of disorganized axial Smc2 staining (white) or with at least one chromosome with additional double axis–like staining (gray), linked telomeres (light blue), or a combination of both linked telomeres and “double axis-like” staining (dark blue). Three hundred metaphases were analyzed for each sample. Bar graph shows mean ± SD from three independent experiments; p value < 0.05; *, p = 0.01–0.05; **, p = 0.001–0.01; two-tailed Student's t test. (D) Representative examples of chromosomes observed in metaphase spreads from control and Smc5- or Smc6-depleted cells stained with DAPI, Smc2, and topo IIα, as indicated. In merged images, Smc2 is shown in red and topo IIα in green. Note that the characteristic barber pole–like alternate pattern of topo IIα and Smc2 distribution in control cells contrasts with the irregular distribution in Smc5/6-depleted cells. Scale bar: 1 μm. (E) Three-dimensional reconstruction of the Smc2 staining of metaphase chromosomes in the Smc5/6-depleted cells.
FIGURE 6:
FIGURE 6:
Chromatin binding profile of topo IIα on human chromosomes in interphase and mitosis in the presence and absence of Smc6, as revealed by ChIP-Seq. Uniquely aligned reads are summed in 100-kb windows along the chromosome for ChIP fractions and WCE. Windows in which the enrichment ratio of ChIP/WCE was higher than 1.0 are highlighted in red (see Materials and Methods). Gene content was calculated for every 500 kb. Representative results for chromosomes 4, 13, and X are shown; these exemplify the requirement of Smc5/6 for the timed binding of topo IIα in interphase and the relocalization of topo IIα in mitosis.
FIGURE 7:
FIGURE 7:
Probing different stages of DNA replication using FACS and PCC assay. (A) RPE-1 cells transfected with an siRNA against Smc5 or Smc6 or a control mock were collected at indicated time points after release from serum starvation, and cell cycle distribution was determined by flow-cytometric analysis of DNA content. (B) PCC-induced nuclei from RPE-1 cells transfected with an siRNA against Smc5 or Smc6 or a control mock were treated with hypotonic buffer, fixed, spread on glass slides, and stained with Giemsa solution. Representative images for indicated cell cycle stages are shown. The band graphs represent the average proportion of cells at different interphase stages in control or siRNA-treated samples at the indicated time points after the release from serum starvation between three independent experiments.
FIGURE 8:
FIGURE 8:
Replication-related DNA damage. RPE-1 cells transfected with an siRNA against Smc5 or Smc6 or a control mock were analyzed at the specified time points after release from serum starvation. (A) Representative immunofluorescence of γH2AX (red) and BLM (green) foci formation in control cells (top panels) and in cells depleted of Smc6 (bottom panels). DAPI staining is shown in blue. A positive control for γH2AX and BLM staining is provided by low doze of aphidicolin treatment (aph 0.4 μM; middle panels). Scale bar: 10 μm. (B) Frequency of γH2AX-positive cells at indicated time points after the release from serum starvation. (C) Frequency of γH2AX-positive cells at the 33-h time point, with or without additional RO-3306 treatment for 12 h, and further classified according to the number of foci per cell as indicated (n > 31 per condition). Pink bars denote means of foci number per cell. (D) Giemsa-stained spread chromosomes from cells depleted of Smc6 or mock (control) were evaluated for their morphology and are summarized in the histogram. Three hundred cells were examined for each experiment. (E) Frequency of curly axial staining of topo IIα in Smc5/6-depleted cells in the presence or absence of RO-3306 for an additional 12 h. Bar graph shows mean ± SD from three independent experiments; p value < 0.05; *, p = 0.01–0.05; **, p = 0.001–0.01; two-tailed Student's t test.
FIGURE 9:
FIGURE 9:
Progression of DNA replication and loading of topo IIα onto sister chromatids in S phase. (A) PCC analysis with EdU pulse-labeling was carried out as described in Figure 8, E and F. Immunofluorescence microscopy images of DNA (DAPI), topo IIα (red in merged images), and EdU (green) are shown. Note that late S phase can be characterized based on two properties: elongated replicating regions and well-defined chromatin masses. Right panels show merged EdU and topo IIα staining. Scale bar: 10 μm. (B) Frequently observed G2-like chromosomes in Smc6 siRNA–treated cells. Note that EdU-positive extended regions of ongoing replication (green) exclude topo IIα axial localization (red). Right panels show merged images. Scale bar: 1 μm. (C) The elongated replicating regions are more often seen in late S phase of Smc5/6-depleted cells. PCC-induced late S-phase cells are assessed for the completion of DNA replication by counting the incidence of elongated replicating regions and defined chromatin masses. (D) Frequency of PCC-induced nuclei at G2 showing persistent EdU staining. One hundred metaphases were analyzed for each sample in (C) and (D). Bar graph shows mean ± SD from three independent experiments; p value < 0.05; *, p = 0.010.05; two-tailed Student's t test.

Similar articles

Cited by

References

    1. Ampatzidou E, Irmisch A, O'Connell MJ, Murray JM. Smc5/6 is required for repair at collapsed replication forks. Mol Cell Biol. 2006;26:9387–9401. - PMC - PubMed
    1. Baumann C, Korner R, Hofmann K, Nigg EA. PICH, a centromere-associated SNF2 family ATPase, is regulated by Plk1 and required for the spindle checkpoint. Cell. 2007;128:101–114. - PubMed
    1. Bermúdez-López M, Ceschia A, de Piccoli G, Colomina N, Pasero P, Aragon L, Torres-Rosell J. The Smc5/6 complex is required for dissolution of DNA-mediated sister chromatid linkages. Nucleic Acids Res. 2010;38:6502–6512. - PMC - PubMed
    1. Chavez A, George V, Agrawal V, Johnson FB. Sumoylation and the structural maintenance of chromosomes (Smc) 5/6 complex slow senescence through recombination intermediate resolution. J Biol Chem. 2010;285:11922–11930. - PMC - PubMed
    1. Chen Y-H, Szakal B, Castellucci F, Branzei D, Zhao X. DNA damage checkpoint and recombinational repair differentially affect the replication stress. Mol Biol Cell. 2013;24:2431–2441. - PMC - PubMed

Publication types

MeSH terms

LinkOut - more resources