

Hospital readmission performance and patterns of readmission: retrospective cohort study of Medicare admissions
- PMID: 24259033
- PMCID: PMC3898430
- DOI: 10.1136/bmj.f6571
Hospital readmission performance and patterns of readmission: retrospective cohort study of Medicare admissions
Abstract
Objectives: To determine whether high performing hospitals with low 30 day risk standardized readmission rates have a lower proportion of readmissions from specific diagnoses and time periods after admission or instead have a similar distribution of readmission diagnoses and timing to lower performing institutions.
Design: Retrospective cohort study.
Setting: Medicare beneficiaries in the United States.
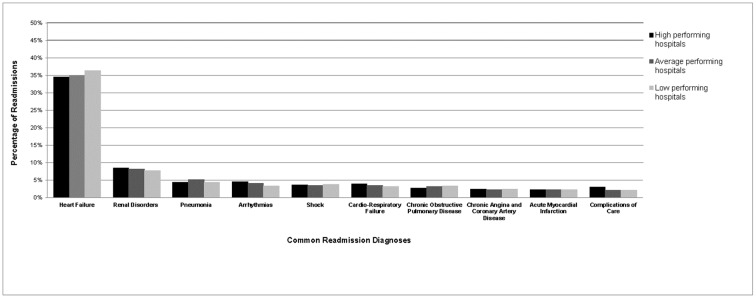
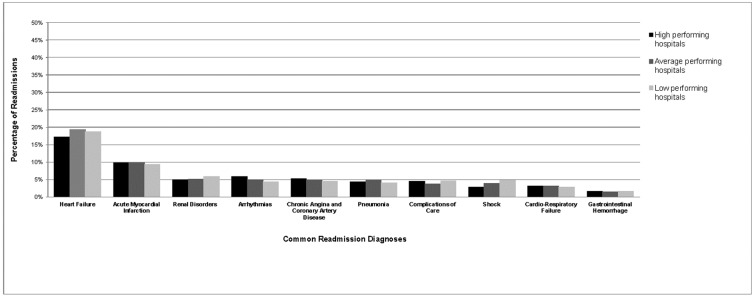
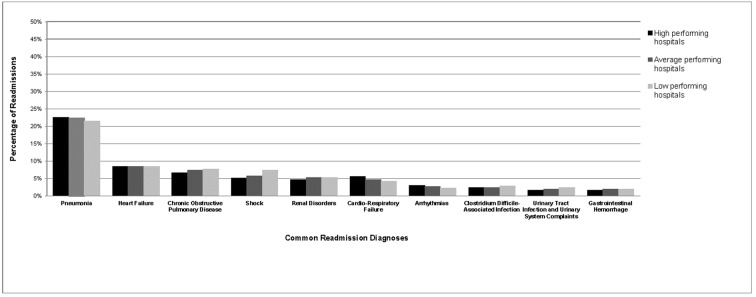
Participants: Patients aged 65 and older who were readmitted within 30 days after hospital admission for heart failure, acute myocardial infarction, or pneumonia in 2007-09.
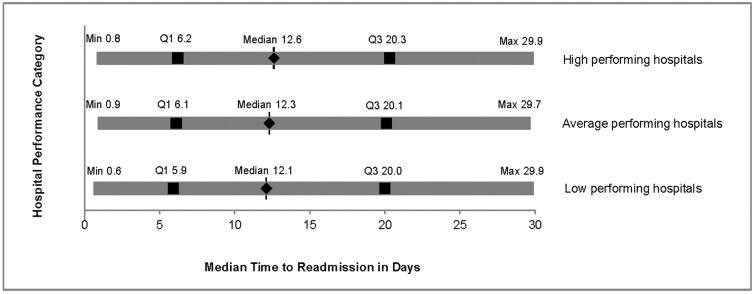
Main outcome measures: Readmission diagnoses were classified with a modified version of the Centers for Medicare and Medicaid Services' condition categories, and readmission timing was classified by day (0-30) after hospital discharge. Hospital 30 day risk standardized readmission rates over the three years of study were calculated with public reporting methods of the US federal government, and hospitals were categorized with bootstrap analysis as having high, average, or low readmission performance for each index condition. High and low performing hospitals had ≥ 95% probability of having an interval estimate respectively less than or greater than the national 30 day readmission rate over the three year period of study. All remaining hospitals were considered average performers.
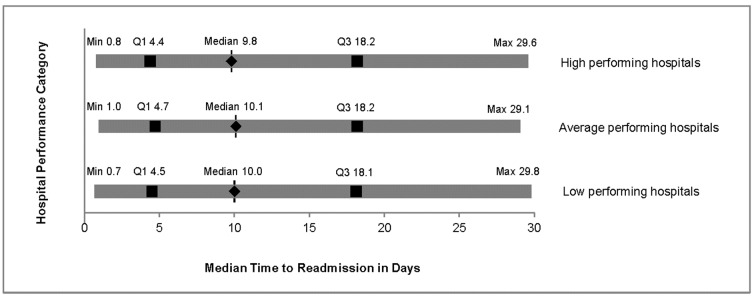
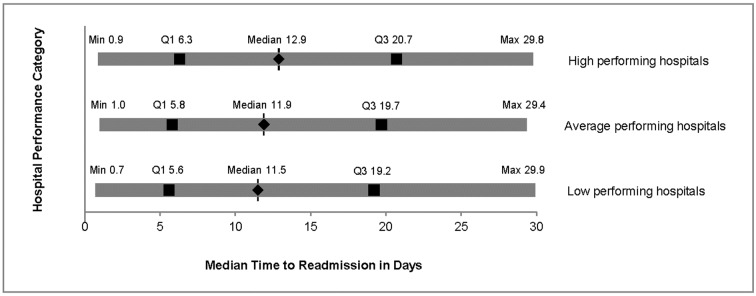
Results: For readmissions in the 30 days after the index admission, there were 320,003 after 1,291,211 admissions for heart failure (4041 hospitals), 102,536 after 517,827 admissions for acute myocardial infarction (2378 hospitals), and 208,438 after 1,135,932 admissions for pneumonia (4283 hospitals). The distribution of readmissions by diagnosis was similar across categories of hospital performance for all three conditions. High performing hospitals had fewer readmissions for all common diagnoses. Median time to readmission was similar by hospital performance for heart failure and acute myocardial infarction, though was 1.4 days longer among high versus low performing hospitals for pneumonia (P<0.001). Findings were unchanged after adjustment for other hospital characteristics potentially associated with readmission patterns.
Conclusions: High performing hospitals have proportionately fewer 30 day readmissions without differences in readmission diagnoses and timing, suggesting the possible benefit of strategies that lower risk of readmission globally rather than for specific diagnoses or time periods after hospital stay.
Conflict of interest statement
Competing interests: All authors have completed the ICMJE uniform disclosure form at
Figures
Comment in
-
Readmission rates.BMJ. 2013 Dec 16;347:f7478. doi: 10.1136/bmj.f7478. BMJ. 2013. PMID: 24342873 No abstract available.
-
Readmission rates reflect how well whole health and social care systems function.BMJ. 2014 Jan 29;348:g1150. doi: 10.1136/bmj.g1150. BMJ. 2014. PMID: 24477016 No abstract available.
References
-
- Krumholz HM, Merrill AR, Schone EM, Schreiner GC, Chen J, Bradley EH, et al. Patterns of hospital performance in acute myocardial infarction and heart failure 30-day mortality and readmission. Circ Cardiovasc Qual Outcomes 2009;2:407-13. - PubMed
-
- Bernheim SM, Grady JN, Lin Z, Wang Y, Savage SV, Bhat KR, et al. National patterns of risk-standardized mortality and readmission for acute myocardial infarction and heart failure. Update on publicly reported outcomes measures based on the 2010 release. Circ Cardiovasc Qual Outcomes 2010;3:459-67. - PMC - PubMed
-
- Lindenauer PK, Bernheim SM, Grady JN, Lin Z, Wang Y, Merrill AR, et al. The performance of US hospitals as reflected in risk-standardized 30-day mortality and readmission rates for Medicare beneficiaries with pneumonia. J Hosp Med 2010;5:E12-8. - PubMed
-
- Centers for Medicare and Medicaid Services. Medicare hospital quality chartbook 2011: performance report on readmission measures for acute myocardial infarction, heart failure, and pneumonia. Centers for Medicare and Medicaid Services, September 2011.
-
- Centers for Medicare and Medicaid Services. Medicare hospital compare quality of care. www.hospitalcompare.hhs.gov/?AspxAutoDetectCookieSupport=1.
Publication types
MeSH terms
Grants and funding
LinkOut - more resources
Full Text Sources
Other Literature Sources
Medical