. 2014 Nov;72(5):1444-59.
doi: 10.1002/mrm.25029. Epub 2013 Nov 20.

Fast quantitative susceptibility mapping with L1-regularization and automatic parameter selection

Affiliations

Fast quantitative susceptibility mapping with L1-regularization and automatic parameter selection

Berkin Bilgic et al. Magn Reson Med. 2014 Nov.

Abstract

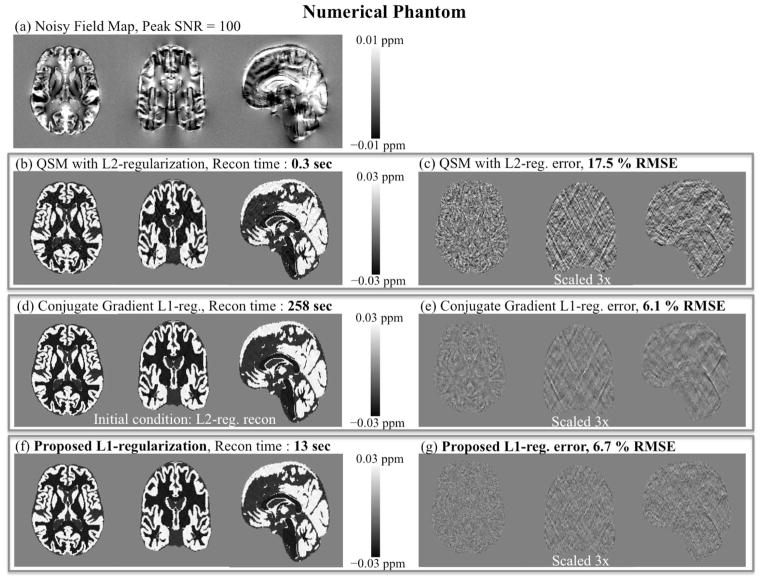
Purpose: To enable fast reconstruction of quantitative susceptibility maps with total variation penalty and automatic regularization parameter selection.

Methods: ℓ(1) -Regularized susceptibility mapping is accelerated by variable splitting, which allows closed-form evaluation of each iteration of the algorithm by soft thresholding and fast Fourier transforms. This fast algorithm also renders automatic regularization parameter estimation practical. A weighting mask derived from the magnitude signal can be incorporated to allow edge-aware regularization.

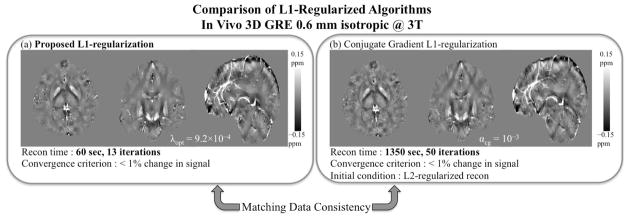
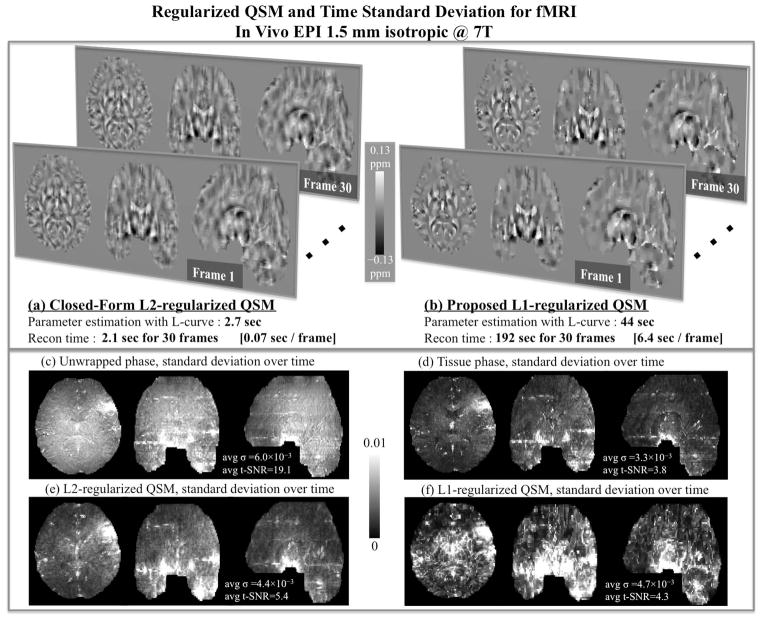
Results: Compared with the nonlinear conjugate gradient (CG) solver, the proposed method is 20 times faster. A complete pipeline including Laplacian phase unwrapping, background phase removal with SHARP filtering, and ℓ(1) -regularized dipole inversion at 0.6 mm isotropic resolution is completed in 1.2 min using MATLAB on a standard workstation compared with 22 min using the CG solver. This fast reconstruction allows estimation of regularization parameters with the L-curve method in 13 min, which would have taken 4 h with the CG algorithm. The proposed method also permits magnitude-weighted regularization, which prevents smoothing across edges identified on the magnitude signal. This more complicated optimization problem is solved 5 times faster than the nonlinear CG approach. Utility of the proposed method is also demonstrated in functional blood oxygen level-dependent susceptibility mapping, where processing of the massive time series dataset would otherwise be prohibitive with the CG solver.

Conclusion: Online reconstruction of regularized susceptibility maps may become feasible with the proposed dipole inversion.

Keywords: L-curve; Quantitative susceptibility mapping; Regularization; Total variation.


Figures

Fig. 1
Fig. 1
QSM with numerical phantom. RMSE values are computed relative to the known, ground-truth susceptibility map. A field map was simulated using the true susceptibility, to which noise with PSNR=100 was added to obtain the noisy field map in (a). QSM with closed-form L2-regularization shown in (b) took 0.3 seconds, and the reconstruction error (c) was 17.5 %. L1-regularized Conjugate Gradient reconstruction took 258 seconds (d), and the error (e) was 6.1 %. Proposed L1-constrained QSM was completed in 13 seconds (f), with an RMSE of 6.7 % (g).
Fig. 2
Fig. 2
Phase processing steps for in vivo 3D GRE data at 0.6 mm resolution. Starting from the coil-combined, wrapped phase in (a), unwrapped phase data are obtained with Laplacian unwrapping (b) in 6 seconds. Further processing with SHARP filtering yielded the tissue field map (c) in 7 seconds.
Fig. 3
Fig. 3
Closed-form L2-constrained reconstruction for 3D GRE. Upper panel: L-curve is traced in 42 seconds, and the parameter value that maximized the curvature was β = 3.2 · 10−2, corresponding to the optimal level of regularization. In (a), (b) and (c), under-, optimally- and over-regularized susceptibility maps are depicted. Each reconstruction took 0.9 seconds of computation time.
Fig. 4
Fig. 4
Proposed L1-constrained reconstruction for 3D GRE. Upper panel: L-curve is traced in 710 seconds, and the parameter value that maximized the curvature was λ = 9.2 · 10−4, corresponding to the optimal level of regularization. In (a), (b) and (c), under-, optimally- and over-regularized susceptibility maps are depicted. Under- and optimally-regularized reconstructions took 60 seconds and 13 iterations to converge, while optimization took was 70 seconds and 15 iterations for the over-regularized case.
Fig. 5
Fig. 5
Comparison of L1-regularized dipole inversion methods for in vivo 3D GRE. Proposed algorithm in (a) converged in 60 seconds and 13 iterations, while it took 1350 seconds and 50 iterations for the Conjugate Gradient algorithm to finish (b).
Fig. 6
Fig. 6
L2- and L1-regularized QSM with and without magnitude prior. Compared to closed-form reconstruction in (a) that is completed in 0.9 seconds, magnitude weighted L2-regularization in (b) requires 88 seconds of processing while increasing conspicuity of high-frequency structures like vessels. Relative to the proposed L1-based method in (c), inclusion of magnitude prior in (d) is computationally more demanding, requiring 275 seconds of reconstruction.
Fig. 7
Fig. 7
Maximum intensity projections (MIPs) of in vivo 3D GRE dataset. Tissue phase MIP is shown in (a), and closed-form L2-based susceptibility map is depicted in (b). Projection for the proposed L2-regularized QSM with magnitude prior is given in (c), and L1-based reconstruction without (d) and with magnitude weighting is shown in (e). Note the increase in the vessel susceptibility values estimated with the methods that utilize magnitude prior.
Fig. 8
Fig. 8
K-space views for tissue phase (a), closed-form QSM (b), proposed L2-regularization with magnitude weighting (c), L1-based reconstruction without (d), and with magnitude prior (e). Note the increase in the k-space content near the magic angle for the methods that utilize magnitude prior.
Fig. 9
Fig. 9
Phase processing steps for in vivo EPI at 1.5 mm isotropic resolution acquired as a time-series (frames 1 to 30). Starting from the coil-combined wrapped phase, application of Laplacian unwrapping and SHARP filtering took 9 seconds for the 30 frames, corresponding to 0.3 seconds/frame processing time.
Fig. 10
Fig. 10
Reconstruction of 30 frames of EPI data with the closed-form L2-regularized QSM shown in (a) was completed in 2.1 seconds, corresponding to 0.07 seconds/frame speed. Using the proposed L1-based method shown in (b), the reconstruction time was 192 seconds for the 30 frames, yielding a processing speed of 6.4 seconds/frame. L-curve parameter estimation took 2.7 seconds for L2- and 44 seconds for L1-constrained reconstruction. Standard deviation maps of phase and susceptibility time-series are depicted in (c)–(f). Raw unwrapped phase in (c) has a standard deviation of 6 · 10−3 over time, and a time-SNR of 19.1 averaged inside the brain mask. For tissue phase shown in (d), these values were σ = 3.3 · 10−3 and t-SNR=3.8. L2-regularized susceptibility time-series had σ = 4.4 · 10−3 and t-SNR=5.4 (e), while L1-based reconstruction returned σ = 4.7 · 10−3 and t-SNR=4.3 (f).

References

    1. Langkammer C, Schweser F, Krebs N, et al. Quantitative susceptibility mapping (QSM) as a means to measure brain iron? A post mortem validation study. Neuro Image. 2012;62:1593–9. doi: 10.1016/j.neuroimage.2012.05.049. - DOI - PMC - PubMed
    1. Zheng W, Nichol H, Liu S, Cheng Y, Haacke E. Measuring iron in the brain using quantitative susceptibility mapping and X-ray fluorescence imaging. Neuro Image. 2013 doi: 10.1016/j.neuroimage.2013.04.022. - DOI - PMC - PubMed
    1. Fan AP, Bilgic B, Benner T, Rosen BR, Adalsteinsson E. Regularized Quantitative Susceptibility Mapping for Phase-based Regional Oxygen Metabolism (PROM) at 7T. Proc Intl Soc Mag Reson Med; 2011; Montreal, Canada. p. 7942.
    1. Fan AP, Benner T, Bolar DS, Rosen BR, Adalsteinsson E. Phase-based regional oxygen metabolism (PROM) using MRI. Magnetic Resonance in Medicine. 2012;67:669–78. doi: 10.1002/mrm.23050. - DOI - PMC - PubMed
    1. Haacke E, Tang J, Neelavalli J, Cheng Y. Susceptibility mapping as a means to visualize veins and quantify oxygen saturation. Journal of Magnetic Resonance Imaging. 2010;32:663–676. doi: 10.1002/jmri.22276. - DOI - PMC - PubMed

Publication types