

Complement protective epitopes and CD55-microtubule complexes facilitate the invasion and intracellular persistence of uropathogenic Escherichia coli
- PMID: 24259524
- PMCID: PMC3975163
- DOI: 10.1093/infdis/jit619
Complement protective epitopes and CD55-microtubule complexes facilitate the invasion and intracellular persistence of uropathogenic Escherichia coli
Abstract
Background: Escherichia coli-bearing Dr-adhesins (Dr+ E. coli) cause chronic pyelonephritis in pregnant women and animal models. This chronic renal infection correlates with the capacity of bacteria to invade epithelial cells expressing CD55. The mechanism of infection remains unknown.
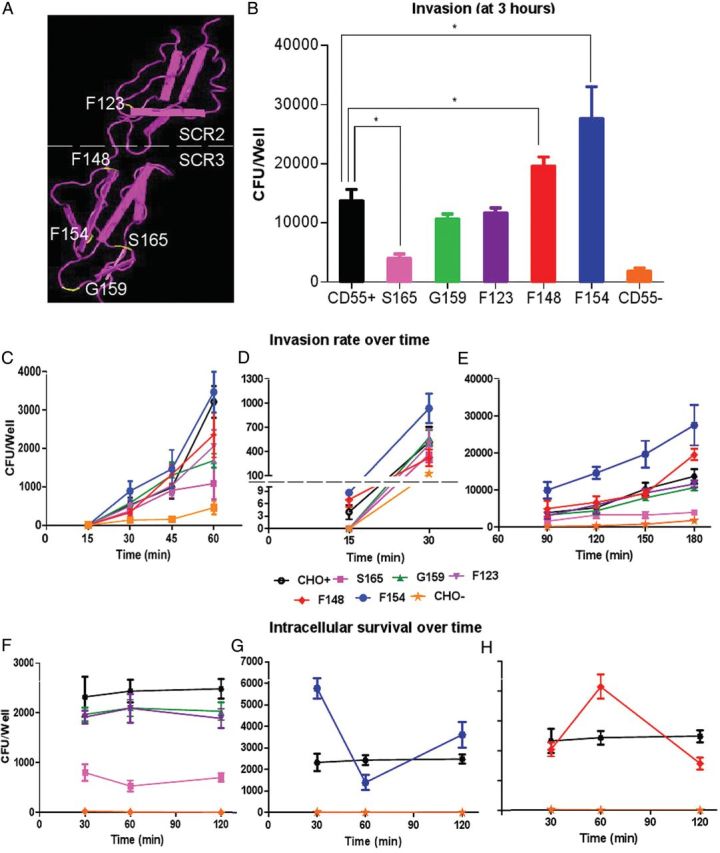
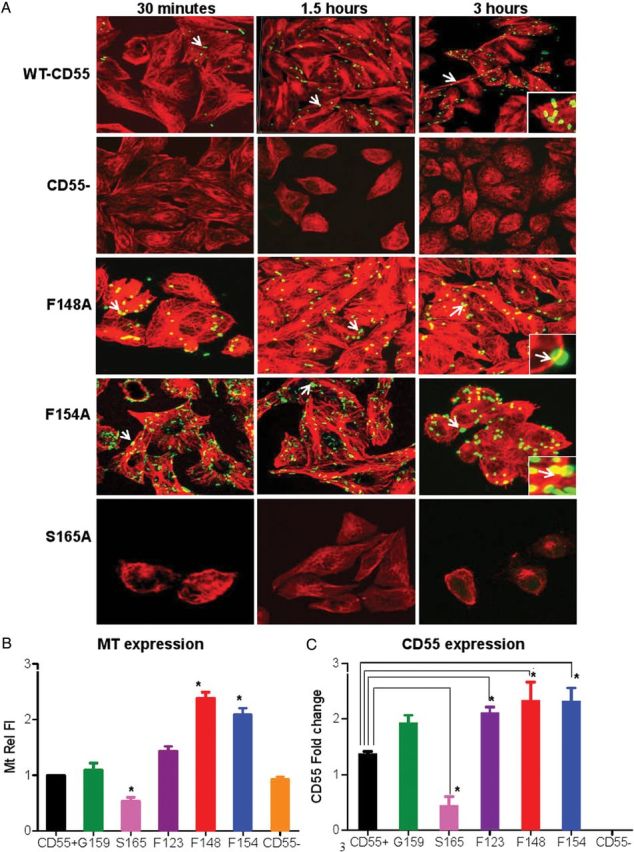
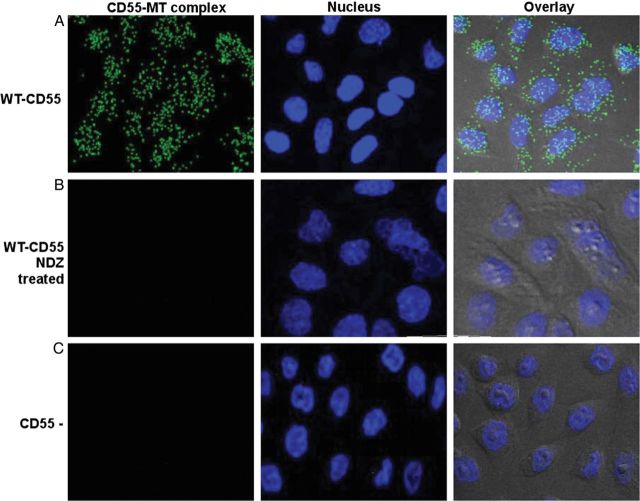
Methods: CD55 amino acids in the vicinity of binding pocket-Ser155 for Dr-adhesin were mutated to alanine and subjected to temporal gentamicin-invasion/gentamicin-survival assay in Chinese hamster ovary cells. CD55/microtubule (MT) responses were studied using confocal/electron microscopy, and 3-dimensional structure analysis.
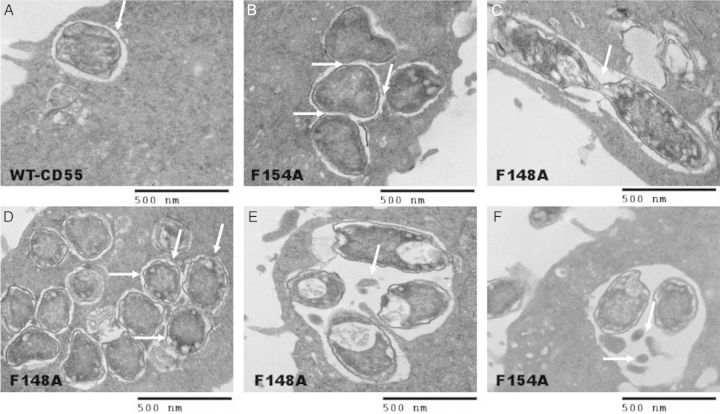
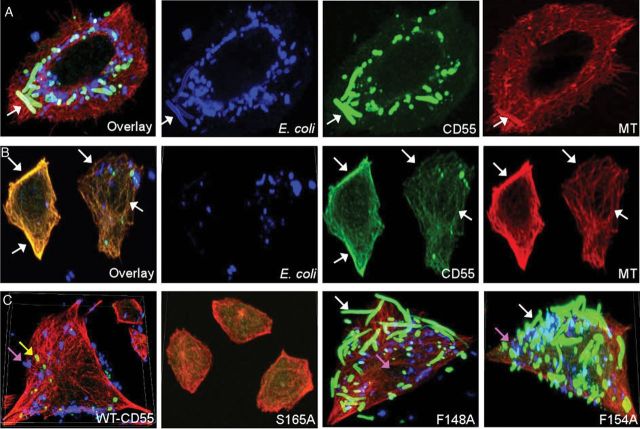
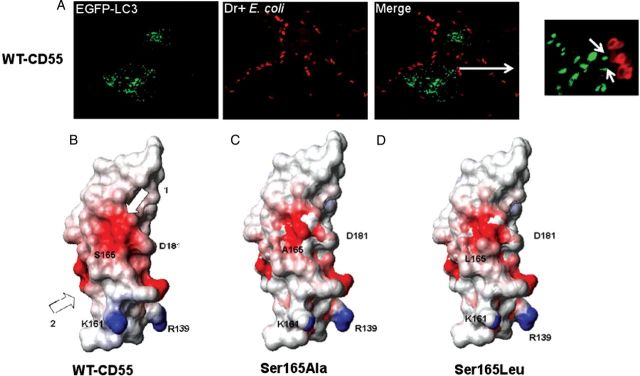
Results: Mutant analysis revealed that complement-protective CD55-Ser165 and CD55-Phe154 epitopes control E. coli invasion by coregulating CD55-MT complex expression. Single-point CD55 mutations changed E. coli to either a minimally invasive (Ser165Ala) or a hypervirulent pathogen (Phe154Ala). Thus, single amino acid modifications with no impact on CD55 structure and bacterial attachment can have a profound impact on E. coli virulence. While CD55-Ser165Ala decreased E. coli invasion and led to dormant intracellular persistence, intracellular E. coli in CD55-Phe154Ala developed elongated forms (multiplying within vacuoles), upregulated CD55-MT complexes, acquired CD55 coat, and escaped phagolysosomal fusion.
Conclusions: E. coli target complement-protective CD55 epitopes for invasion and exploit CD55-MT complexes to escape phagolysosomal fusion, leading to a nondestructive parasitism that allows bacteria to persist intracellularly.
Keywords: CD55; Dr+ E. coli; intracellular persistence; invasion; microtubules.
Figures
Similar articles
-
Structure-function analysis of decay-accelerating factor: identification of residues important for binding of the Escherichia coli Dr adhesin and complement regulation.Infect Immun. 2002 Aug;70(8):4485-93. doi: 10.1128/IAI.70.8.4485-4493.2002. Infect Immun. 2002. PMID: 12117960 Free PMC article.
-
Human diffusely adhering Escherichia coli expressing Afa/Dr adhesins that use human CD55 (decay-accelerating factor) as a receptor does not bind the rodent and pig analogues of CD55.Infect Immun. 2004 Aug;72(8):4859-63. doi: 10.1128/IAI.72.8.4859-4863.2004. Infect Immun. 2004. PMID: 15271948 Free PMC article.
-
Recruitment of CD55 and CD66e brush border-associated glycosylphosphatidylinositol-anchored proteins by members of the Afa/Dr diffusely adhering family of Escherichia coli that infect the human polarized intestinal Caco-2/TC7 cells.Infect Immun. 2000 Jun;68(6):3554-63. doi: 10.1128/IAI.68.6.3554-3563.2000. Infect Immun. 2000. PMID: 10816511 Free PMC article.
-
Interactions of CD55 with non-complement ligands.Biochem Soc Trans. 2002 Nov;30(Pt 6):1014-9. doi: 10.1042/bst0301014. Biochem Soc Trans. 2002. PMID: 12440964 Review.
-
DAF as a therapeutic target for steroid hormones: implications for host-pathogen interactions.Adv Exp Med Biol. 2013;735:83-96. doi: 10.1007/978-1-4614-4118-2_5. Adv Exp Med Biol. 2013. PMID: 23402020 Review.
Cited by
-
Estrogen receptor alpha differentially modulates host immunity in the bladder and kidney in response to urinary tract infection.Am J Clin Exp Urol. 2019 Jun 15;7(3):110-122. eCollection 2019. Am J Clin Exp Urol. 2019. PMID: 31317051 Free PMC article.
-
Decay-accelerating factor 1 deficiency exacerbates leptospiral-induced murine chronic nephritis and renal fibrosis.PLoS One. 2014 Jul 17;9(7):e102860. doi: 10.1371/journal.pone.0102860. eCollection 2014. PLoS One. 2014. PMID: 25032961 Free PMC article.
-
Validation of research trajectory 1 of an Exposome framework: Exposure to benzo(a)pyrene confers enhanced susceptibility to bacterial infection.Environ Res. 2016 Apr;146:173-84. doi: 10.1016/j.envres.2015.12.027. Epub 2016 Jan 5. Environ Res. 2016. PMID: 26765097 Free PMC article.
-
Strengths and Limitations of Model Systems for the Study of Urinary Tract Infections and Related Pathologies.Microbiol Mol Biol Rev. 2016 Mar 2;80(2):351-67. doi: 10.1128/MMBR.00067-15. Print 2016 Jun. Microbiol Mol Biol Rev. 2016. PMID: 26935136 Free PMC article. Review.
-
In Vivo Role of Two-Component Regulatory Systems in Models of Urinary Tract Infections.Pathogens. 2023 Jan 10;12(1):119. doi: 10.3390/pathogens12010119. Pathogens. 2023. PMID: 36678467 Free PMC article. Review.
References
-
- Hart A, Nowicki BJ, Reisner B, et al. Ampicillin-resistant Escherichia coli in gestational pyelonephritis: increased occurrence and association with the colonization factor Dr adhesin. J Infect Dis. 2001;183:1526–9. - PubMed
-
- Greer LG, Roberts SW, Sheffield JS, et al. Ampicillin resistance and outcome differences in acute antepartum pyelonephritis. Infect Dis Obs Gyn. 2008 doi:10.1155/2008/891426. - DOI - PMC - PubMed
-
- Hourcade D, Holers VM, Atkinson JP. The regulators of complement activation (RCA) gene cluster. Adv Immunol. 1989;45:381–416. - PubMed
Publication types
MeSH terms
Substances
Grants and funding
- UL1 TR000445/TR/NCATS NIH HHS/United States
- G12 MD007586/MD/NIMHD NIH HHS/United States
- L40 RR025970/RR/NCRR NIH HHS/United States
- S10 RR025497/RR/NCRR NIH HHS/United States
- S10RR025970/RR/NCRR NIH HHS/United States
- HD041687/HD/NICHD NIH HHS/United States
- U54MD007593/MD/NIMHD NIH HHS/United States
- HD055648/HD/NICHD NIH HHS/United States
- R01 HD055648/HD/NICHD NIH HHS/United States
- U54 RR026140/RR/NCRR NIH HHS/United States
- U54 CA163069/CA/NCI NIH HHS/United States
- U54 CA091408/CA/NCI NIH HHS/United States
- UL1TR000445/TR/NCATS NIH HHS/United States
- U54CA091408/CA/NCI NIH HHS/United States
- U54RR026140/RR/NCRR NIH HHS/United States
- U54 MD007593/MD/NIMHD NIH HHS/United States
- R01 HD041687/HD/NICHD NIH HHS/United States
LinkOut - more resources
Full Text Sources
Other Literature Sources
Miscellaneous
