. 2013 Nov 20;33(47):18368-80.
doi: 10.1523/JNEUROSCI.1064-13.2013.

Salivary peptide tyrosine-tyrosine 3-36 modulates ingestive behavior without inducing taste aversion

Affiliations

Salivary peptide tyrosine-tyrosine 3-36 modulates ingestive behavior without inducing taste aversion

Maria D Hurtado et al. J Neurosci. .

Abstract

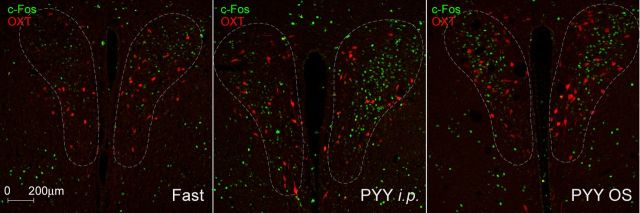
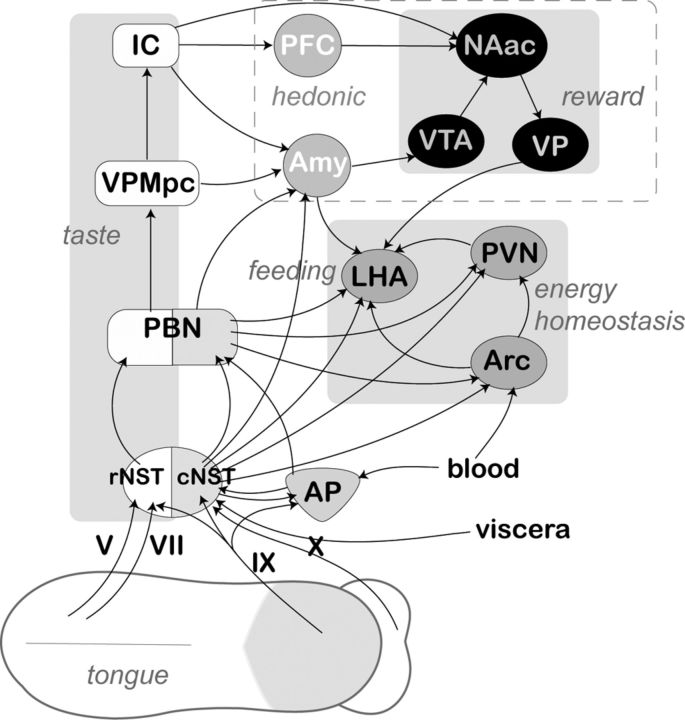
Hormone peptide tyrosine-tyrosine (PYY) is secreted into circulation from the gut L-endocrine cells in response to food intake, thus inducing satiation during interaction with its preferred receptor, Y2R. Clinical applications of systemically administered PYY for the purpose of reducing body weight were compromised as a result of the common side effect of visceral sickness. We describe here a novel approach of elevating PYY in saliva in mice, which, although reliably inducing strong anorexic responses, does not cause aversive reactions. The augmentation of salivary PYY activated forebrain areas known to mediate feeding, hunger, and satiation while minimally affecting brainstem chemoreceptor zones triggering nausea. By comparing neuronal pathways activated by systemic versus salivary PYY, we identified a metabolic circuit associated with Y2R-positive cells in the oral cavity and extending through brainstem nuclei into hypothalamic satiety centers. The discovery of this alternative circuit that regulates ingestive behavior without inducing taste aversion may open the possibility of a therapeutic application of PYY for the treatment of obesity via direct oral application.


Figures

Figure 1.
Figure 1.
Effect of PYY3–36 treatment on aversive response. Individual flavor consumption: saline paired flavor versus treatment paired flavor. A, B, Liquid paradigm (n = 8 each group). C, Solid food paradigm (n = 8 each group). For details, see Results. *p ≤ 0.05 **p ≤ 0.01, ***p ≤ 0.001.
Figure 2.
Figure 2.
Salivary PYY binds to Y2Rs in the tongue epithelia. A, D, Representative images of a sagittal section of the murine tongue subjected to 125I-PYY binding applied orally in vivo. B, E, Images of the tongue from a mouse in which 125I-PYY was coadministered with the Y2R-specific antagonist BIIE0246. C, F, Images of the tongue from a mouse in which 125I-PYY was injected intraperitoneally. D–F, Micrographs of histological sections of the tongue epithelium with H&E staining; silver granules (black dots) colocalize with 125I-PYY.
Figure 3.
Figure 3.
Effect of PYY3–36 OS on c-fos expression in the brainstem. A, Diagram of the horizontal representation of the NST (nucleus of solitary track) in the mouse. Filled ovals indicate the overlapping termination patterns of the facial nerve (VII), the linguotonsilar branch of the glossopharyngeal nerve (IX), and the superior laryngeal branch of the vagus nerve (X). Shaded areas on the right aspect indicate the sectioned areas in the rNST and AP; sections were collected bilaterally. 4V, Fourth ventricle. B, Diagram of the coronal representation of the medial rostral area of the solitary tract. sol, Solitary tract. Filled oval indicates tabulated area. C, Tabulated values expressed as average number of c-Fos+ cells per section (n = 4). D, Shown are representative photomicrographs of the c-fos activity in the rostral part of the solitary tract in mice treated as indicated on the respective panels. E, Diagram of the coronal representation of the intermediate area of the solitary tract and representative photomicrographs of the c-fos activity. ST, Solitary tract; C, central canal; X, dorsal motor nucleus of the vagus; XII, hypoglossal nucleus. Dashed rectangle designates the areas shown as photomicrographs; dashed ovals designate areas included in the c-Fos staining count. F, Tabulated values expressed as average number of c-Fos+ cells per section in the mNST (n = 4). G, Tabulated values expressed as average number of c-Fos+ cells per section in the AP. *p ≤ 0.05, **p ≤ 0.01, ***p ≤ 0.001. H, Representative photomicrographs of the c-fos activity in mNST catecholaminergic (TH) neurons.
Figure 4.
Figure 4.
Effect of PYY3–36 OS on c-fos expression in the PBN of the brainstem. A, Shown are representative photomicrographs of the c-fos activity in the PBN in mice treated as indicated on the respective panels. scp, Superior cerebellar peduncle. B, Tabulated values expressed as average number of c-Fos+ cells per section in the lePBN (n = 4). C, Tabulated values expressed as average number of c-Fos+ cells per section in the mPBN. *p ≤ 0.05, **p ≤ 0.01.
Figure 5.
Figure 5.
c-Fos activity in NST catecholaminergic (TH) and GLPergic neurons. A, D, and G show individual channels for c-Fos. B, E, and H show individual channels for TH. C, F, and I show combined channels. Open arrowheads indicate neurons positive for both c-Fos and TH. J shows c-Fos expression (green) in the GLP-1-IR neurons (red) in the mNST under treatment conditions indicated in each panel. Open arrowheads indicate neurons positive for both c-Fos and GLP-1.
Figure 6.
Figure 6.
Effect of PYY3–36 OS on c-fos expression in the Arc (top row), PVN (middle row), and LHA (bottom row). Dash ovals indicate areas included in the tabulations. Panels in the rightmost column show tabulated values expressed as average number of c-Fos+ cells per section (n = 4 mice per group). *p ≤ 0.05, **p ≤ 0.01, ***p ≤ 0.001.
Figure 7.
Figure 7.
Effect of PYY3–36 treatment on p-ERK1/2 activation in the Arc. A, E, and I show low-magnification images of p-ERK1/2 and α-MSH colocalization. B, F, J and C, G, K are magnified images (individual channels) of the areas outlined by a dotted rectangles in the leftmost column. D, H, and L are images from the combined channels. Open arrowheads indicate neurons expressing both p-ERK1/2 and α-MSH; filled arrowheads designate neurons expressing α-MSH only.
Figure 8.
Figure 8.
Effect of PYY3–36 treatment on p-ERK1/2 activation in the PVN. A, E, and I show low-magnification images of p-ERK1/2 and AVP (shown in pseudocolored red hue for better viewing) colocalization. B, F, J and C, G, K are magnified images (individual channels) of the areas outlined by the dotted rectangles in the leftmost column. D, H, and L are images from the combined channels. Open arrowheads indicate neurons positive for both p-ERK1/2 and AVP; filled arrowheads designate neurons positive for p-ERK1/2 only.
Figure 9.
Figure 9.
Effect of PYY3–36 treatment on c-fos expression in the OXT neurons in the PVN. There is no overlap in the c-Fos expression (green) and OXT-IR neurons (red) in the PVN under the treatment conditions indicated in each panel.
Figure 10.
Figure 10.
Basic diagram displaying main putative anorexigenic pathway originating in the tongue epithelia and/or taste cells innervated with afferent projections of neurons from trigeminal nerve V, cranial nerve VII (chorda tympani branch), glossopharyngeal nerve IX, or superior laryngeal branch of the cranial nerve X. For clarity, only ascending projection are shown, although the majority of these pathways include reciprocal descending fibers. The rostral (gustatory) and caudal (visceral) subdivisions of the NST are shown by white and shaded areas, respectively. The distinctive shading of the PBN is used to show the existence of functionally segregated subnuclei. Anatomically and functionally related nuclei of the forebrain areas are designated by similar shaped and shaded ovals, and their functional roles are displayed in italics. VPMpc, Parvicellular part of the posteromedial ventral thalamic nucleus; IC, insular cortex; PFC, prefrontal complex; VTA, ventral tegmental area; NAac, nucleus accumbens; VP, ventral pallidum.

Similar articles

Cited by

References

    1. Acosta A, Hurtado MD, Gorbatyuk O, La Sala M, Duncan D, Aslanidi G, Campbell-Thompson M, Zhang L, Herzog H, Voutetakis A, Baum BJ, Zolotukhin S. Salivary PYY: a putative bypass to satiety. PLoS One. 2011;6:e26137. doi: 10.1371/journal.pone.0026137. - DOI - PMC - PubMed
    1. Aoyagi T, Kusakawa S, Sanbe A, Hiroyama M, Fujiwara Y, Yamauchi J, Tanoue A. Enhanced effect of neuropeptide Y on food intake caused by blockade of the V(1A) vasopressin receptor. Eur J Pharmacol. 2009;622:32–36. doi: 10.1016/j.ejphar.2009.09.017. - DOI - PubMed
    1. Batterham RL, Cowley MA, Small CJ, Herzog H, Cohen MA, Dakin CL, Wren AM, Brynes AE, Low MJ, Ghatei MA, Cone RD, Bloom SR. Gut hormone PYY(3–36) physiologically inhibits food intake. Nature. 2002;418:650–654. doi: 10.1038/nature00887. - DOI - PubMed
    1. Belecky TL, Smith DV. Postnatal development of palatal and laryngeal taste buds in the hamster. J Comp Neurol. 1990;293:646–654. doi: 10.1002/cne.902930409. - DOI - PubMed
    1. Belgardt BF, Brüning JC. CNS leptin and insulin action in the control of energy homeostasis. Ann N Y Acad Sci. 2010;1212:97–113. doi: 10.1111/j.1749-6632.2010.05799.x. - DOI - PubMed

Publication types

MeSH terms