

Unexpected events induce motor slowing via a brain mechanism for action-stopping with global suppressive effects
- PMID: 24259571
- PMCID: PMC3834054
- DOI: 10.1523/JNEUROSCI.3456-13.2013
Unexpected events induce motor slowing via a brain mechanism for action-stopping with global suppressive effects
Abstract
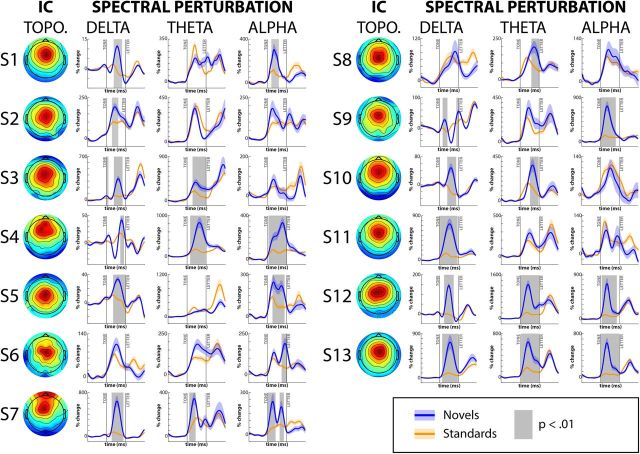
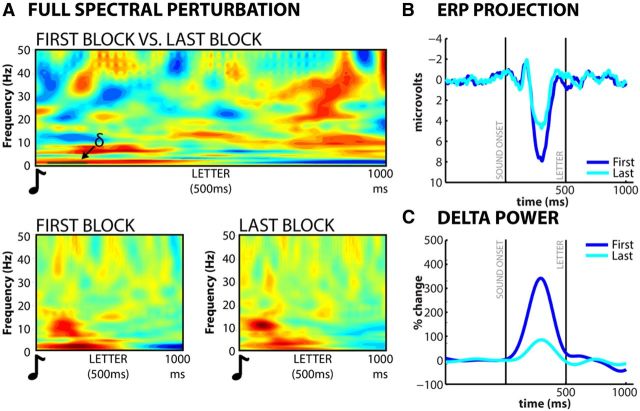
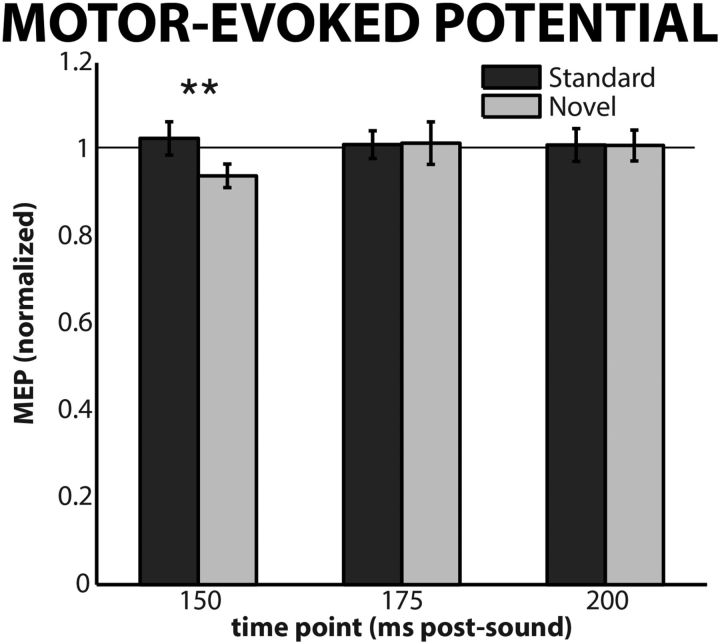
When an unexpected event occurs in everyday life (e.g., a car honking), one experiences a slowing down of ongoing action (e.g., of walking into the street). Motor slowing following unexpected events is a ubiquitous phenomenon, both in laboratory experiments as well as such everyday situations, yet the underlying mechanism is unknown. We hypothesized that unexpected events recruit the same inhibition network in the brain as does complete cancellation of an action (i.e., action-stopping). Using electroencephalography and independent component analysis in humans, we show that a brain signature of successful outright action-stopping also exhibits activity following unexpected events, and more so in blocks with greater motor slowing. Further, using transcranial magnetic stimulation to measure corticospinal excitability, we show that an unexpected event has a global motor suppressive effect, just like outright action-stopping. Thus, unexpected events recruit a common mechanism with outright action-stopping, moreover with global suppressive effects. These findings imply that we can now leverage the considerable extant knowledge of the neural architecture and functional properties of the stopping system to better understand the processing of unexpected events, including perhaps how they induce distraction via global suppression.
Figures
Similar articles
-
Perceptual Surprise Improves Action Stopping by Nonselectively Suppressing Motor Activity via a Neural Mechanism for Motor Inhibition.J Neurosci. 2018 Feb 7;38(6):1482-1492. doi: 10.1523/JNEUROSCI.3091-17.2017. Epub 2018 Jan 5. J Neurosci. 2018. PMID: 29305533 Free PMC article.
-
Transcranial magnetic stimulation reveals dissociable mechanisms for global versus selective corticomotor suppression underlying the stopping of action.Cereb Cortex. 2012 Feb;22(2):363-71. doi: 10.1093/cercor/bhr112. Epub 2011 Jun 10. Cereb Cortex. 2012. PMID: 21666129 Free PMC article.
-
Response suppression by automatic retrieval of stimulus-stop association: evidence from transcranial magnetic stimulation.J Cogn Neurosci. 2012 Sep;24(9):1908-18. doi: 10.1162/jocn_a_00247. Epub 2012 May 25. J Cogn Neurosci. 2012. PMID: 22624606 Free PMC article.
-
On the Globality of Motor Suppression: Unexpected Events and Their Influence on Behavior and Cognition.Neuron. 2017 Jan 18;93(2):259-280. doi: 10.1016/j.neuron.2016.12.013. Neuron. 2017. PMID: 28103476 Free PMC article. Review.
-
Not moving: the fundamental but neglected motor function.Philos Trans R Soc Lond B Biol Sci. 2017 Apr 19;372(1718):20160190. doi: 10.1098/rstb.2016.0190. Philos Trans R Soc Lond B Biol Sci. 2017. PMID: 28242724 Free PMC article. Review.
Cited by
-
Frontal theta as a mechanism for cognitive control.Trends Cogn Sci. 2014 Aug;18(8):414-21. doi: 10.1016/j.tics.2014.04.012. Epub 2014 May 15. Trends Cogn Sci. 2014. PMID: 24835663 Free PMC article. Review.
-
Visual information following object grasp supports digit position variability and swift anticipatory force control.J Neurophysiol. 2023 Jun 1;129(6):1389-1399. doi: 10.1152/jn.00104.2023. Epub 2023 May 10. J Neurophysiol. 2023. PMID: 37162174 Free PMC article.
-
Picture Novelty Influences Response Selection and Inhibition: The Role of the In-Group Bias and Task-Difficulty.PLoS One. 2016 Oct 27;11(10):e0165470. doi: 10.1371/journal.pone.0165470. eCollection 2016. PLoS One. 2016. PMID: 27788213 Free PMC article.
-
The Effect of Cognitive Load on Auditory Susceptibility During Automated Driving.Hum Factors. 2022 Nov;64(7):1195-1209. doi: 10.1177/0018720821998850. Epub 2021 Mar 11. Hum Factors. 2022. PMID: 33705213 Free PMC article.
-
Involuntary motor responses are elicited both by rare sounds and rare pitch changes.Sci Rep. 2024 Aug 30;14(1):20235. doi: 10.1038/s41598-024-70776-x. Sci Rep. 2024. PMID: 39215115 Free PMC article.
References
-
- Alegre M, Lopez-Azcarate J, Obeso I, Wilkinson L, Rodriguez-Oroz MC, Valencia M, Garcia-Garcia D, Guridi J, Artieda J, Jahanshahi M, Obeso JA. The subthalamic nucleus is involved in successful inhibition in the stop-signal task: a local field potential study in Parkinson's disease. Exp Neurol. 2013;239:1–12. doi: 10.1016/j.expneurol.2012.08.027. - DOI - PubMed
-
- Benjamini Y, Hochberg Y. Controlling the false discovery rate–a practical and powerful approach to multiple testing. J Roy Stat Soc B Met. 1995;57:289–300.
Publication types
MeSH terms
Grants and funding
LinkOut - more resources
Full Text Sources
Other Literature Sources