. 2013 Nov 20;33(47):18531-9.
doi: 10.1523/JNEUROSCI.1278-13.2013.

Control of basal ganglia output by direct and indirect pathway projection neurons

Affiliations

Control of basal ganglia output by direct and indirect pathway projection neurons

Benjamin S Freeze et al. J Neurosci. .

Abstract

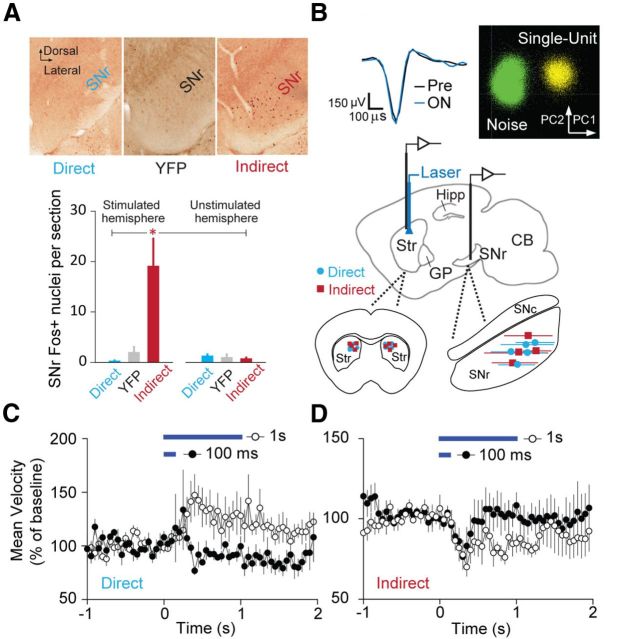
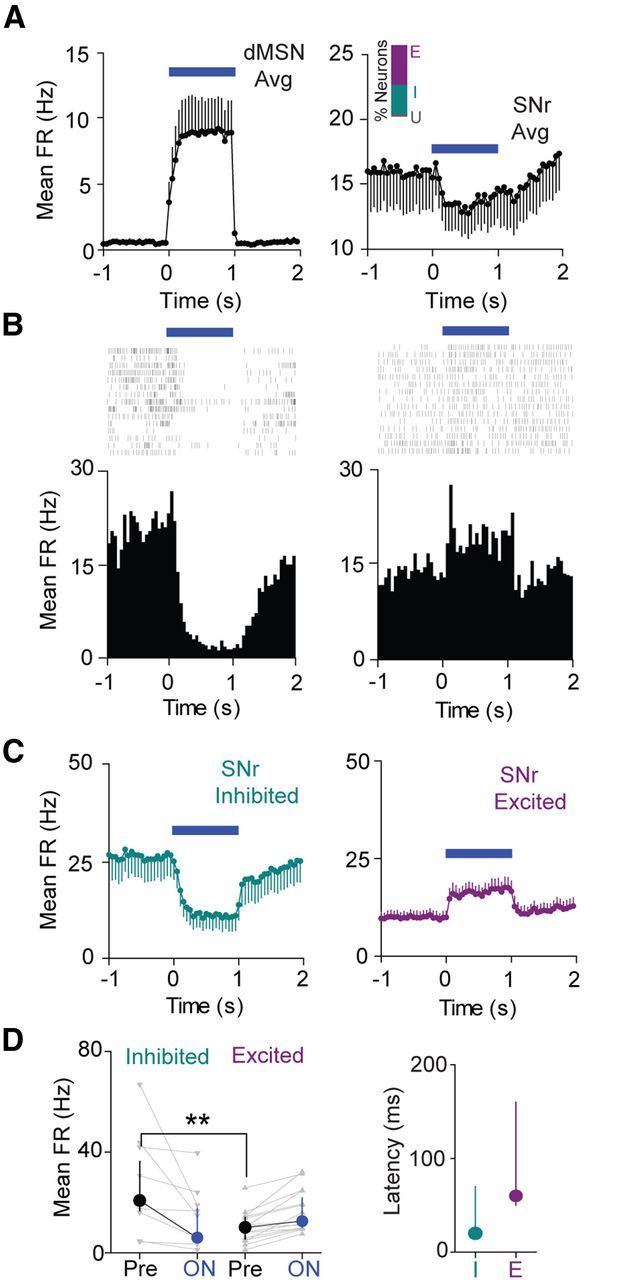
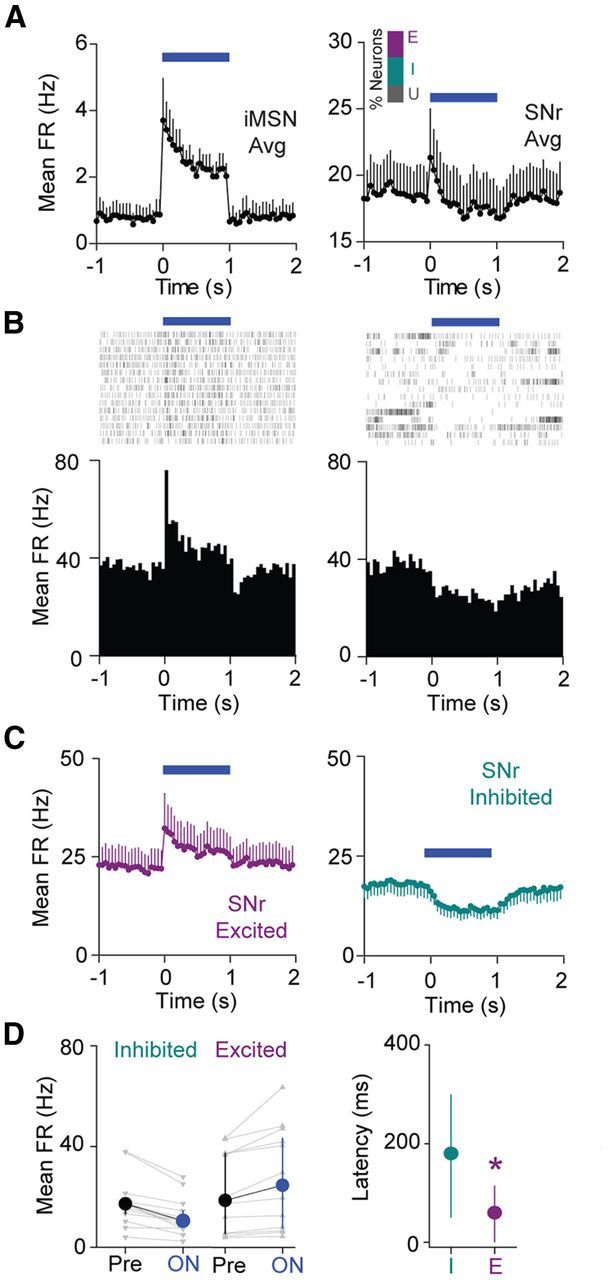
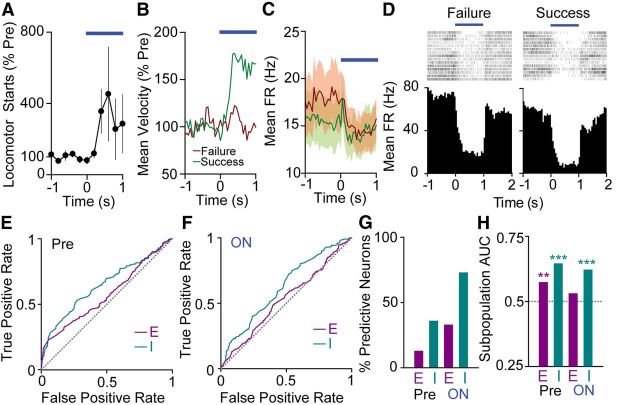
The direct and indirect efferent pathways from striatum ultimately reconverge to influence basal ganglia output nuclei, which in turn regulate behavior via thalamocortical and brainstem motor circuits. However, the distinct contributions of these two efferent pathways in shaping basal ganglia output are not well understood. We investigated these processes using selective optogenetic control of the direct and indirect pathways, in combination with single-unit recording in the basal ganglia output nucleus substantia nigra pars reticulata (SNr) in mice. Optogenetic activation of striatal direct and indirect pathway projection neurons produced diverse cellular responses in SNr neurons, with stimulation of each pathway eliciting both excitations and inhibitions. Despite this response heterogeneity, the effectiveness of direct pathway stimulation in producing movement initiation correlated selectively with the subpopulation of inhibited SNr neurons. In contrast, effective indirect pathway-mediated motor suppression was most strongly influenced by excited SNr neurons. Our results support the theory that key basal ganglia output neurons serve as an inhibitory gate over motor output that can be opened or closed by striatal direct and indirect pathways, respectively.


Figures

Figure 1.
Figure 1.
Optogenetic activation of basal ganglia circuits. A, Top, Coronal SNr sections stained for Fos following direct or indirect pathway stimulation. A coronal section for a YFP control experiment is shown for comparison. Bottom, Quantification of Fos+ nuclei for stimulated and unstimulated direct pathway (n = 4 hemispheres stim, n = 3 unstim), YFP (n = 5 hemispheres stim, n = 3 unstim), and indirect pathway (n = 7 hemispheres stim, n = 8 unstim) groups. B, Top left, Average extracellular action potential waveforms for a representative SNr neuron in the Pre and ON periods. Top right, 2D PCA clustering of spike waveforms for the same SNr unit. Middle, Sagittal schematic (1.7 mm lateral from midline) showing placement of bilateral optical fibers in dorsomedial striatum with unilateral recording array either in striatum or SNr. Bottom left, Coronal striatal schematic showing bilateral placement of optical fibers for direct (n = 5) and indirect (n = 4) pathway experiments. Bottom right, Sagittal SNr schematic showing the extent of recording sites for direct (n = 5) and indirect (n = 4) pathway experiments. C, Time courses of mouse open-field velocity in response to 100 ms or 1 s direct pathway activation (denoted by blue bars; n = 5 mice). D, Mean velocity for 100 ms or 1 s indirect pathway activation (n = 4 mice). CB, Cerebellum; SNc, substantia nigra pars compacta.
Figure 2.
Figure 2.
Direct pathway activation selectively inhibits subsets of SNr neurons. A, Left, Average time course (±SEM) of striatal dMSN activation in response to 1 s illumination (n = 6 neurons). Right, Average time course (±SEM) of SNr neuron modulation in response to 1 s striatal illumination (n = 27 neurons). Time is binned at 50 ms in each case. Inset, Bar graph showing percentage of neurons excited (E), inhibited (I), or without significant response (U) to direct pathway activation. B, Left, Raster plot and perievent histogram for an SNr neuron strongly inhibited by 1 s direct pathway activation (blue bar). Right, Raster plot and perievent histogram for an SNr neuron excited by 1 s direct pathway activation. C, Left, Average time course for inhibited neurons (n = 11 neurons). Right, Average time course for excited neurons (n = 15 neurons). Error bars indicate SEM. Time is binned at 50 ms. D, Left, Changes in mean FR from Pre to ON conditions for inhibited cells and excited cells. Individual cells are shown in gray, and the group medians (±IQR) are shown in black or blue. Right, Median (±IQR) latencies to a significant change in firing rate for both inhibited and excited cell populations (n = 11 inhibited, n = 15 excited).
Figure 3.
Figure 3.
Indirect pathway activation selectively excites subsets of SNr neurons. A, Left, Average time course (±SEM) of striatal iMSN activation in response to 1 s illumination (n = 6 neurons). Right, Average time course (±SEM) of SNr neuron modulation in response to 1 s striatal illumination. Inset, Bar graph showing percentage of neurons excited (E), inhibited (I), or without significant response (U) to indirect pathway activation. B, Left, Raster plot and perievent histogram for an SNr neuron strongly excited by 1 s indirect pathway activation. Right, Raster plot and perievent histogram for an SNr neuron inhibited by 1 s indirect pathway activation. C, Left, Average time course for excited neurons (n = 12 neurons). Right, Average time course for inhibited neurons (n = 13 neurons). Error bars indicate SEM. Time is binned at 50 ms. D, Left, Changes in mean FR from Pre to ON conditions for inhibited cells and excited cells. Individual cells are shown in gray, and the group medians (±IQR) are shown in black or blue. Right, Median (±IQR) latencies to a significant change in FR for both inhibited and excited cell populations (n = 12 excited, n = 13 inhibited).
Figure 4.
Figure 4.
Inhibited SNr cells predict movement initiation. A, Mean (±SEM) locomotor starts per animal (n = 5) for 1 s dMSN activation. B, Group mean normalized velocity for trials that do not elicit a locomotor start (“failures”; red) and trials that do elicit a locomotor start (“successes”; green), indicating the abrupt increase in velocity for success trials. C, Population mean FR for failure and success trials (n = 27 neurons). SEM is shaded in corresponding colors. D, Raster plots and perievent histograms for the same SNr neuron in failure trials (left) and success trials (right). E, Left, ROC curves for excited (E; n = 15 neurons) and inhibited (I; n = 11 neurons) subpopulation responses in the Pre period. The gray dashed line is defined by the equation true positive rate = false positive rate and represents lack of discrimination between behavioral states. F, ROC curves for excited (E; n = 15) and inhibited (I; n = 11) subpopulations in the ON period. G, Percentage of individual neurons with significant discriminability for behavioral outcome in the Pre and ON periods (E, excited, n = 15 neurons; I, inhibited, n = 11 neurons). H, Area under the ROC curve (AUC) for excited (E; n = 15 neurons) and inhibited (I; n = 11 neurons) subpopulation responses in the Pre and ON periods. The gray dashed line represents AUC = 0.5.
Figure 5.
Figure 5.
Excited SNr neurons predict motor suppression. A, Mean (±SEM) immobility starts per animal (n = 4) for 1 s iMSN activation. B, Group mean normalized velocity for all trials that do not elicit an immobility start (“failures”; red) and those that do elicit an immobility start (“successes”; green). C, Population mean FR for failure and success trials (n = 33 neurons). SEM shaded in corresponding colors. D, Raster plots and perievent histograms for the same SNr neuron in failure trials (left) and success trials (right). E, ROC curves for excited (E; n = 12 neurons) and inhibited (I; n = 13 neurons) subpopulations in the Pre period. The gray line is defined by the equation true positive rate = false positive rate and represents lack of discrimination between behavioral states. F, ROC curves for excited (E; n = 12 neurons) and inhibited (I; n = 13 neurons) subpopulations in the ON period. G, Percentage of individual neurons with significant discriminability for behavioral outcome in the Pre and ON periods (E, excited, n = 12 neurons; I, inhibited, n = 13 neurons). H, Area under the ROC curve (AUC) for excited (E; n = 12 neurons) and inhibited (I; n = 13 neurons) subpopulation responses in the Pre and ON periods. The gray dashed line represents AUC = 0.5.

References

    1. Albin RL, Young AB, Penney JB. The functional anatomy of basal ganglia disorders. Trends Neurosci. 1989;12:366–375. doi: 10.1016/0166-2236(89)90074-X. - DOI - PubMed
    1. Anderson ME, Horak FB. Influence of the globus pallidus on arm movements in monkeys. III. Timing of movement-related information. J Neurophysiol. 1985;54:433–448. - PubMed
    1. Brotchie P, Iansek R, Horne MK. Motor function of the monkey globus pallidus. 1. Neuronal discharge and parameters of movement. Brain. 1991;114:1667–1683. doi: 10.1093/brain/114.4.1667. - DOI - PubMed
    1. Bryden DW, Johnson EE, Diao X, Roesch MR. Impact of expected value on neural activity in rat substantia nigra pars reticulata. Eur J Neurosci. 2011;33:2308–2317. doi: 10.1111/j.1460-9568.2011.07705.x. - DOI - PMC - PubMed
    1. Cui G, Jun SB, Jin X, Pham MD, Vogel SS, Lovinger DM, Costa RM. Concurrent activation of striatal direct and indirect pathways during action initiation. Nature. 2013;494:238–242. doi: 10.1038/nature11846. - DOI - PMC - PubMed

Publication types

MeSH terms