. 2013 Nov 20;33(47):18597-607.
doi: 10.1523/JNEUROSCI.1548-13.2013.

Similarity of fMRI activity patterns in left perirhinal cortex reflects semantic similarity between words

Affiliations

Similarity of fMRI activity patterns in left perirhinal cortex reflects semantic similarity between words

Rose Bruffaerts et al. J Neurosci. .

Abstract

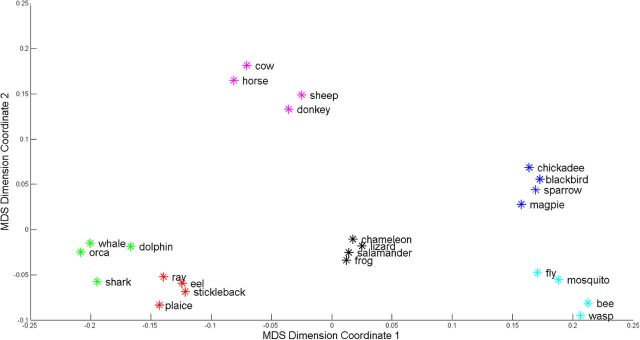
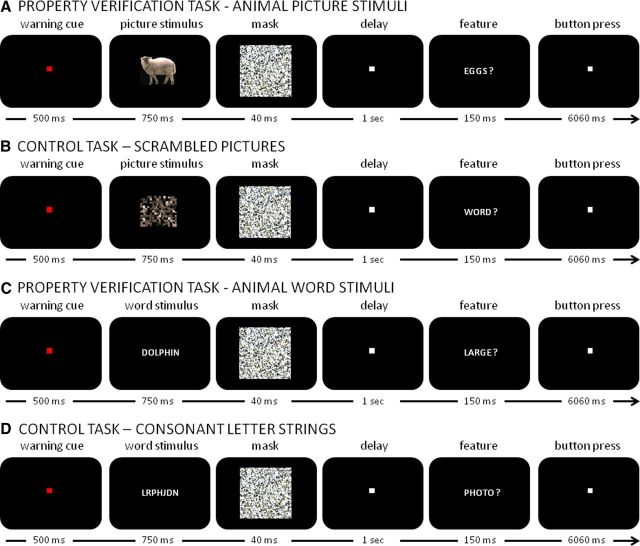
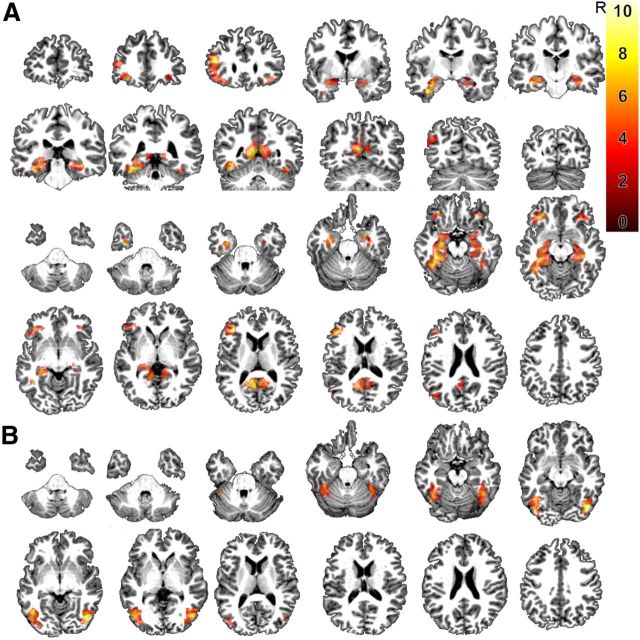
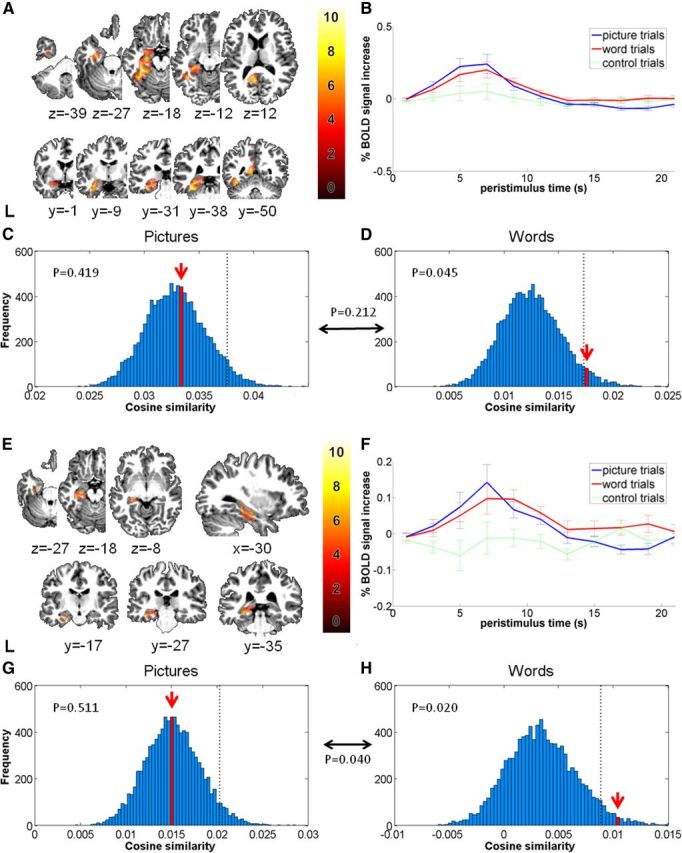
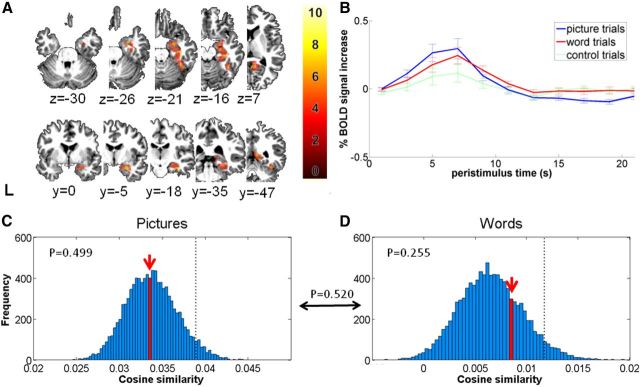
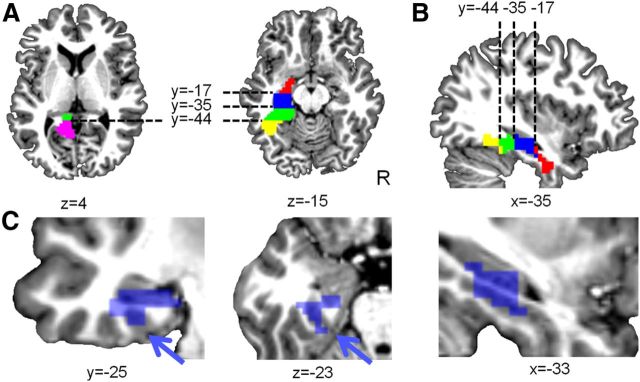
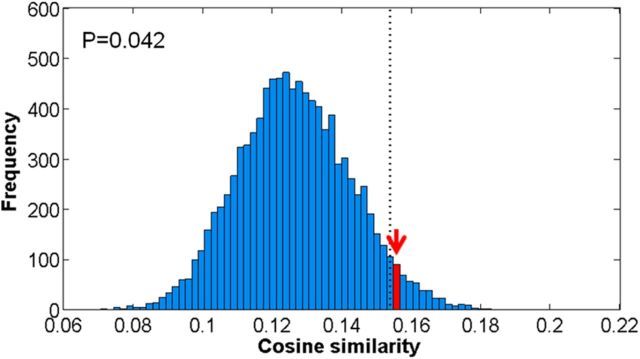
How verbal and nonverbal visuoperceptual input connects to semantic knowledge is a core question in visual and cognitive neuroscience, with significant clinical ramifications. In an event-related functional magnetic resonance imaging (fMRI) experiment we determined how cosine similarity between fMRI response patterns to concrete words and pictures reflects semantic clustering and semantic distances between the represented entities within a single category. Semantic clustering and semantic distances between 24 animate entities were derived from a concept-feature matrix based on feature generation by >1000 subjects. In the main fMRI study, 19 human subjects performed a property verification task with written words and pictures and a low-level control task. The univariate contrast between the semantic and the control task yielded extensive bilateral occipitotemporal activation from posterior cingulate to anteromedial temporal cortex. Entities belonging to a same semantic cluster elicited more similar fMRI activity patterns in left occipitotemporal cortex. When words and pictures were analyzed separately, the effect reached significance only for words. The semantic similarity effect for words was localized to left perirhinal cortex. According to a representational similarity analysis of left perirhinal responses, semantic distances between entities correlated inversely with cosine similarities between fMRI response patterns to written words. An independent replication study in 16 novel subjects confirmed these novel findings. Semantic similarity is reflected by similarity of functional topography at a fine-grained level in left perirhinal cortex. The word specificity excludes perceptually driven confounds as an explanation and is likely to be task dependent.


Conflict of interest statement

The authors declare no conflicting financial interests.

Figures

Figure 1.
Figure 1.
Visual representation of the semantic clusters and semantic distances between entities, based on the feature generation data collected by De Deyne et al. (2008). For visualization, data reduction of the similarity matrix to two dimensions was performed by means of multidimensional scaling (MDS) (MATLAB 2011b, Statistics Toolbox). The six semantic clusters correspond to livestock (purple), birds (blue), insects (cyan), fish (red), herpetofauna (black), and large marine animals (green).
Figure 2.
Figure 2.
Schematic of the (A, C) property verification and (B, D) control task for (A, B) picture and (C, D) word trials.
Figure 3.
Figure 3.
A, Coronal and axial slices depicting the main effect of task (feature verification task for words and pictures vs control task for words and pictures) at a voxel-level inference threshold of uncorrected p < 0.001 combined with a cluster-level inference of p < 0.05 (Poline et al. (1997)). B, Axial slices showing the interaction effect of task and modality at the aforementioned threshold. The color scale indicates the T values of the contrasts.
Figure 4.
Figure 4.
Semantic clustering effects in the left occipitotemporal VOI (A–D) and the left perirhinal subdivision (E–H). A, Transverse and coronal slices depicting the VOI as an overlay. The color scale indicates the T values of the contrasts. B, Plots of the peristimulus response function show the percentage signal change after stimulus onset elicited by property verification and control trials. Error bars indicate 1 SEM across subjects. C, D, Probability distributions for the effect of semantic cluster. The red arrow indicates the ACS of the left occipitotemporal activity patterns between entities belonging to a same cluster, presented as (C) pictures or (D) words. x-axis: cosine similarity averaged over the group of subjects. y-axis: absolute frequency of a given average cosine similarity value across a total of 10,000 random permutation labelings. Dotted line: 95th percentile of the distribution. The p value in between the word histogram and the picture histogram is the result of the Wilcoxon rank sign test comparing the rank of words versus the rank of pictures within their respective distributions. E–H, The bottom shows the same results in the left perirhinal VOI.
Figure 5.
Figure 5.
Semantic clustering effects in right occipitotemporal VOI. A, Transverse and coronal slices depicting the VOI as an overlay. The color scale indicates the T values of the contrasts. B, Plots of the peristimulus response function show the percentage signal change after stimulus onset elicited by feature verification trials using word or picture presentations of the animal stimuli. Error bars indicate 1 SEM across subjects. C, D, Probability distributions for the effect of semantic cluster. The red arrow indicates the ACS of the right occipitotemporal activity patterns between entities belonging to a same cluster, presented as (C) pictures or (D) words. x-axis: cosine similarity averaged over the group of subjects. y-axis: absolute frequency of a given average cosine similarity value across a total of 10,000 random permutation labelings. Dotted line: 95th percentile of the distribution. The p value in between the word histogram and the picture histogram is the result of the Wilcoxon rank sign test comparing the rank of words versus the rank of pictures within their respective distributions.
Figure 6.
Figure 6.
(A) Axial and (B) sagittal slices depicting the subdivisions of the left occipitotemporal VOI. Posteriorly the occipitotemporal activity cluster consisted of a superior and medial component and an inferior and ventral component. These were preserved as separate components and demarcated from the more anterior portion so that each component contained ∼160 voxels. The Euclidean centers of the subdivisions are [−12,−57,15] (magenta), [−38,−51,−15] (yellow), [−26,−39,−8] (green), [−26,−25,−14] (blue), and [−26,−9,−26] (red) (Table 4). C, Coronal, axial and sagittal view of the left perirhinal VOI. The blue arrow indicates the collateral sulcus, which is the ventral border of the left perirhinal VOI (blue).
Figure 7.
Figure 7.
Probability distributions for the RSA. The red arrow indicates the cosine similarity between the similarity matrix based on behavioral data (De Deyne et al., 2008) and the similarity matrix based on the fMRI data derived from the response patterns within left perirhinal cortex with words as input modality. x-axis: cosine similarity averaged over the group of subjects. y-axis: absolute frequency of a given cosine similarity value across a total of 10,000 random permutation labelings. Dotted line: 95th percentile of the distribution.

References

    1. Baayen RH, Piepenbrock R, van Rijn H. The CELEX lexical database (CD-ROM) Philadelphia: University of Pennsylvania, Linguistic Data Consortium; 1993.
    1. Binder JR, Desai RH, Graves WW, Conant LL. Where is the semantic system? A critical review and meta-analysis of 120 functional neuroimaging studies. Cereb Cortex. 2009;19:2767–2796. doi: 10.1093/cercor/bhp055. - DOI - PMC - PubMed
    1. Binney RJ, Embleton KV, Jefferies E, Parker GJ, Lambon Ralph MA. The ventral and inferolateral aspects of the anterior temporal lobe are crucial in semantic memory: evidence from a novel direct comparison of distortion-corrected fMRI, rTMS, and semantic dementia. Cereb Cortex. 2010;20:2728–2738. doi: 10.1093/cercor/bhq019. - DOI - PubMed
    1. Binney RJ, Parker GJ, Lambon Ralph MA. Convergent connectivity and graded specialization in the rostral human temporal lobe as revealed by diffusion-weighted imaging probabilistic tractography. J Cogn Neurosci. 2012;24:1998–2014. doi: 10.1162/jocn_a_00263. - DOI - PubMed
    1. Bright P, Moss H, Tyler LK. Unitary vs multiple semantics: PET studies of word and picture processing. Brain Lang. 2004;89:417–432. doi: 10.1016/j.bandl.2004.01.010. - DOI - PubMed

Publication types