

The landscape of inappropriate laboratory testing: a 15-year meta-analysis
- PMID: 24260139
- PMCID: PMC3829815
- DOI: 10.1371/journal.pone.0078962
The landscape of inappropriate laboratory testing: a 15-year meta-analysis
Abstract
Background: Laboratory testing is the single highest-volume medical activity and drives clinical decision-making across medicine. However, the overall landscape of inappropriate testing, which is thought to be dominated by repeat testing, is unclear. Systematic differences in initial vs. repeat testing, measurement criteria, and other factors would suggest new priorities for improving laboratory testing.
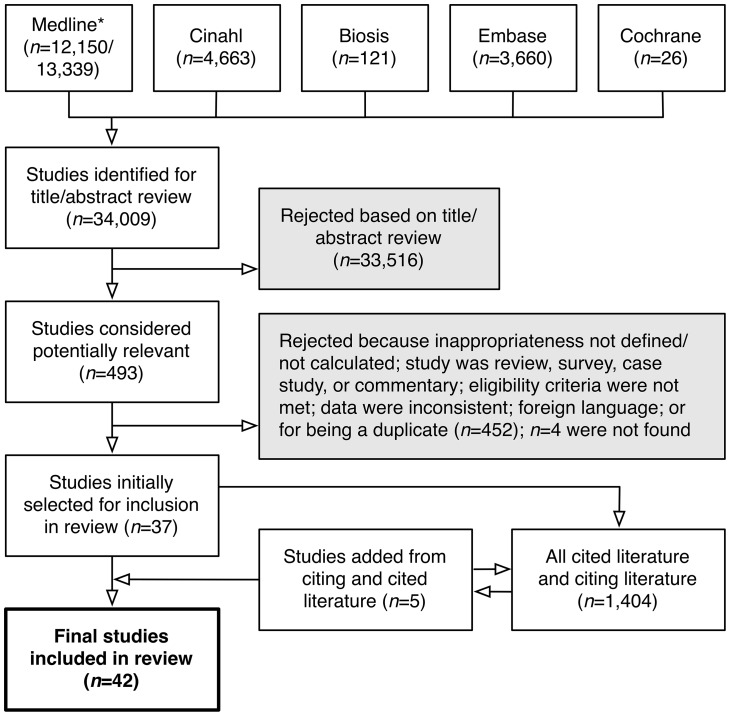
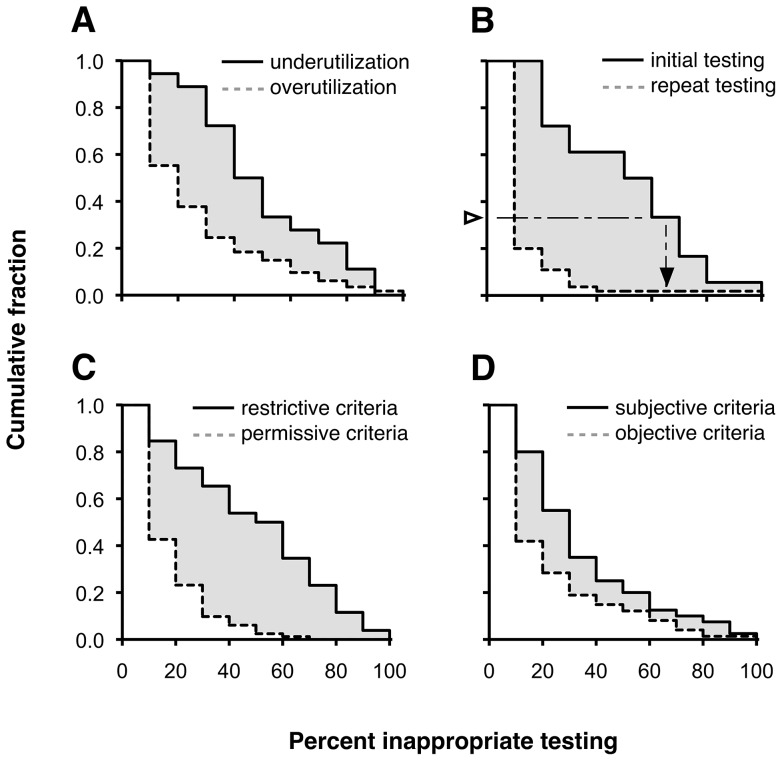
Methods: A multi-database systematic review was performed on published studies from 1997-2012 using strict inclusion and exclusion criteria. Over- vs. underutilization, initial vs. repeat testing, low- vs. high-volume testing, subjective vs. objective appropriateness criteria, and restrictive vs. permissive appropriateness criteria, among other factors, were assessed.
Results: Overall mean rates of over- and underutilization were 20.6% (95% CI 16.2-24.9%) and 44.8% (95% CI 33.8-55.8%). Overutilization during initial testing (43.9%; 95% CI 35.4-52.5%) was six times higher than during repeat testing (7.4%; 95% CI 2.5-12.3%; P for stratum difference <0.001). Overutilization of low-volume tests (32.2%; 95% CI 25.0-39.4%) was three times that of high-volume tests (10.2%; 95% CI 2.6-17.7%; P<0.001). Overutilization measured according to restrictive criteria (44.2%; 95% CI 36.8-51.6%) was three times higher than for permissive criteria (12.0%; 95% CI 8.0-16.0%; P<0.001). Overutilization measured using subjective criteria (29.0%; 95% CI 21.9-36.1%) was nearly twice as high as for objective criteria (16.1%; 95% CI 11.0-21.2%; P = 0.004). Together, these factors explained over half (54%) of the overall variability in overutilization. There were no statistically significant differences between studies from the United States vs. elsewhere (P = 0.38) or among chemistry, hematology, microbiology, and molecular tests (P = 0.05-0.65) and no robust statistically significant trends over time.
Conclusions: The landscape of overutilization varies systematically by clinical setting (initial vs. repeat), test volume, and measurement criteria. Underutilization is also widespread, but understudied. Expanding the current focus on reducing repeat testing to include ordering the right test during initial evaluation may lead to fewer errors and better care.
Conflict of interest statement
Figures
Comment in
-
Reducing our carbon footprint in the haematology laboratory: A shared responsibility.Int J Lab Hematol. 2023 Oct;45(5):778-780. doi: 10.1111/ijlh.14060. Epub 2023 Mar 26. Int J Lab Hematol. 2023. PMID: 36967596 No abstract available.
References
-
- Alexander B (2012) Reducing healthcare costs through appropriate test utilization. Critical Values 5: 6–8.
-
- Fisher E, Shortell S (2010) Accountable care organizations: accountable for what, to whom, and how. JAMA 304: 1715–1716. - PubMed
-
- McClellan M, McKethan A, Lewis J, Roski J, Fisher E (2010) A national strategy to put accountable care into practice. Health Aff (Millwood) 29: 982–990. - PubMed
Publication types
MeSH terms
LinkOut - more resources
Full Text Sources
Other Literature Sources
Medical
