. 2013 Nov 18;8(11):e79215.
doi: 10.1371/journal.pone.0079215. eCollection 2013.

Paracrine effects of bone marrow-derived endothelial progenitor cells: cyclooxygenase-2/prostacyclin pathway in pulmonary arterial hypertension

Affiliations

Paracrine effects of bone marrow-derived endothelial progenitor cells: cyclooxygenase-2/prostacyclin pathway in pulmonary arterial hypertension

Dong-Mei Jiang et al. PLoS One. .

Abstract

Background: Endothelial dysfunction is the pathophysiological characteristic of pulmonary arterial hypertension (PAH). Some paracrine factors secreted by bone marrow-derived endothelial progenitor cells (BMEPCs) have the potential to strengthen endothelial integrity and function. This study investigated whether BMEPCs have the therapeutic potential to improve monocrotaline (MCT)-induced PAH via producing vasoprotective substances in a paracrine fashion.

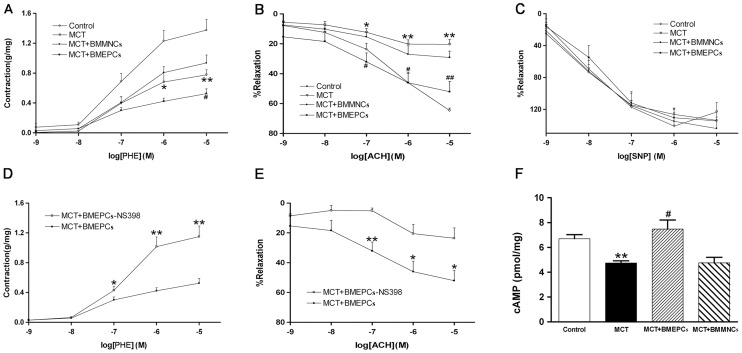
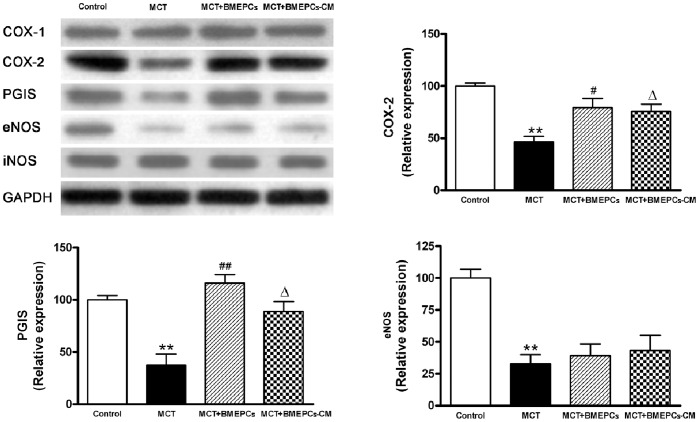
Methods and results: Bone marrow-derived mononuclear cells were cultured for 7 days to yield BMEPCs. 24 hours or 3 weeks after exposure to BMEPCs in vitro or in vivo, the vascular reactivity, cyclooxygenase-2 (COX-2) expression, prostacyclin (PGI2) and cAMP release in isolated pulmonary arteries were examined respectively. Treatment with BMEPCs could improve the relaxation of pulmonary arteries in MCT-induced PAH and BMEPCs were grafted into the pulmonary bed. The COX-2/prostacyclin synthase (PGIS) and its progenies PGI2/cAMP were found to be significantly increased in BMEPCs treated pulmonary arteries, and this action was reversed by a selective COX-2 inhibitor, NS398. Moreover, the same effect was also observed in conditioned medium obtained from BMEPCs culture.

Conclusions: Implantation of BMEPCs effectively ameliorates MCT-induced PAH. Factors secreted in a paracrine fashion from BMEPCs promote vasoprotection by increasing the release of PGI2 and level of cAMP.


Conflict of interest statement

Competing Interests: The authors have declared that no competing interests exist.

Figures

Figure 1
Figure 1. Metabolic pathways of arachidonic acid metabolism.
Indomethacin: a nonselective COX inhibitor, NS-398: a selective COX-2 inhibitor, SC-560: a selective COX-1 inhibitor.
Figure 2
Figure 2. Characterization of BMEPCs derived from rat bone marrow.
(A) BMMNCs (0 day) were globe-like shape (×200). (B) After 7 days, Dil-ac-LDL positive cells were red. (C) FITC-Lectin-BS-1 positive cells were green. (D) Dil-ac-LDL/FITC-Lectin-BS-1 double-positive cells were differentiating BMEPCs (×400).
Figure 3
Figure 3. The expression of VEGF and distribution of Ad-GFP labeled BMEPCs.
(A) Bar diagram representing significantly elevated content of VEGF in conditioned medium from BMEPCs (**P<0.01, n = 6). (B) Green fluorescent expression of adenovirus-green fluorescent protein (Ad-GFP) on BMEPCs (×100). (C, D) Implanted Ad-GFP labeled BMEPCs were distributed into lung tissues. (E, F) Ad-GFP labeled BMEPCs were incorporated into pulmonary arterioles (×200).
Figure 4
Figure 4. The effects of BMEPCs on pulmonary vascular reactivity.
(A) PHE-induced contraction in pulmonary arteries. (B, C) ACH and SNP-induced relaxation. (D, E) The effect of NS-398 on PHE-induced contraction and ACH-induced relaxation. The contractile response was measured and presented in grams per milligram tissue weight for pulmonary arteries. Relaxation was expressed as the percentage of precontraction with PHE. (F) Bar diagram representing reduced content of cAMP in MCT group, but significantly enhanced by BMEPCs. While BMMNCs did not improve the cAMP level. (*P<0.05, **P<0.01 vs. control; # P<0.05, ## P<0.01 vs. MCT group, n = 8).
Figure 5
Figure 5. COX-2, PGIS and COX-1 expression in pulmonary arteries after exposure to BMEPCs and BMEPCs-CM quantified by western blot analysis.
(**P<0.01 vs. control; Δ P<0.05, ## P<0.01 vs. MCT group, n = 6).
Figure 6
Figure 6. The effects of BMEPCs implantation on PAH in vivo.
(A) The body weight change. (**P<0.01 vs. 21 days control; ## P<0.01 vs. 42 days control, n = 6). (B) The change of right heart systolic pressure (RVSP) (**P<0.01 vs. 21 days control; ## P<0.01 vs. 42 days control; Δ P<0.05 vs. 42 days MCT group, n = 6). (C) The ratio of right to left ventricular plus septal weight [RV/(LV+IVS)] on day 42 after MCT injection (**P<0.01 vs. control; # P<0.05 vs. MCT group, n = 6). (D) The ratio of lungs to body weight (L/BW) (**P<0.01 vs. control; # P<0.05 vs. MCT group, n = 6). Representative hematoxylin-eosin staining of paraffin embedded rat lung tissue. (E) Pulmonary arterioles of the control group showing very thin media. (F) Markedly thicken pulmonary arterioles walls on day 42 after MCT injection. (G) Pulmonary arterioles treatment with BMEPCs. (H) The percentage of wall thickness (15 vessels per rat). Total magnification, ×400. Scale bar = 50 µm. (**P<0.01 vs. control; ## P<0.01 vs. MCT group, n = 6).
Figure 7
Figure 7. COX-2-PGIS-COX-1, eNOS and iNOS expression in pulmonary arteries after implantation of BMEPCs and BMEPCs-CM quantified by western blot analysis.
(**P<0.01 vs. control; # P<0.05, Δ P<0.05, ## P<0.01 vs. MCT group, n = 6).
Figure 8
Figure 8. The effects of BMEPCs on the release of vasofactors.
(A) The production of 6-keto-Prostaglandin F1α (6-keto-PGF1α) in pulmonary arteries. (B) The production of Prostaglandin E2 (PGE2). (C) The production of Thromboxane B2 (TXB2). (D) The content of cAMP in pulmonary arteries (*P<0.05, **P<0.01 vs. control; # P<0.05, + P<0.05 ## P<0.01, ++ P<0.01 vs. MCT group; Δ P<0.05, ΔΔ P<0.01 vs. MCT+BMEPCs group incubation with Medium 199; $ P<0.05, $$ P<0.01 vs. MCT+BMEPCs-CM group incubation with Medium 199, n = 6).
Figure 9
Figure 9. Immunohistochemical staining in pulmonary arteries of rats (arrow).
(A) The negative control group. (B) The reduced expression of COX-2 in MCT group. (C, D) The increased expression of COX-2 in BMEPCs and BMEPCs-CM groups (×400).

References

    1. D’Alonzo GE, Barst RJ, Ayres SM, Bergofsky EH, Brundage BH, et al. (1991) Survival in patients with primary pulmonary hypertension. Results from a national prospective registry. Ann Intern Med 115: 343–349. - PubMed
    1. Fuster V, Steele PM, Edwards WD, Gersh BJ, McGoon MD, et al. (1984) Primary pulmonary hypertension: natural history and the importance of thrombosis. Circulation 70: 580–587. - PubMed
    1. Rabinovitch M (2008) Molecular pathogenesis of pulmonary arterial hypertension.J Clin Invest. 118: 2372–2379. - PMC - PubMed
    1. Christman BW, McPherson CD, Newman JH, King GA, Bernard GR, et al. (1992) An imbalance between the excretion of thromboxane and prostacyclin metabolites in pulmonary hypertension. N Engl J Med 327: 70–75. - PubMed
    1. Geraci MW, Gao B, Shepherd DC, Moore MD, Westcott JY, et al. (1999) Pulmonary prostacyclin synthase overexpression in transgenic mice protects against development of hypoxic pulmonary hypertension. J Clin Invest 103: 1509–1515. - PMC - PubMed

Publication types