. 2013 Nov 19;8(11):e79447.
doi: 10.1371/journal.pone.0079447. eCollection 2013.

Macular cone abnormalities in retinitis pigmentosa with preserved central vision using adaptive optics scanning laser ophthalmoscopy

Affiliations

Macular cone abnormalities in retinitis pigmentosa with preserved central vision using adaptive optics scanning laser ophthalmoscopy

Yukiko Makiyama et al. PLoS One. .

Abstract

Purpose: To assess macular photoreceptor abnormalities in eyes with retinitis pigmentosa (RP) with preserved central vision using adaptive optics scanning laser ophthalmoscopy (AO-SLO).

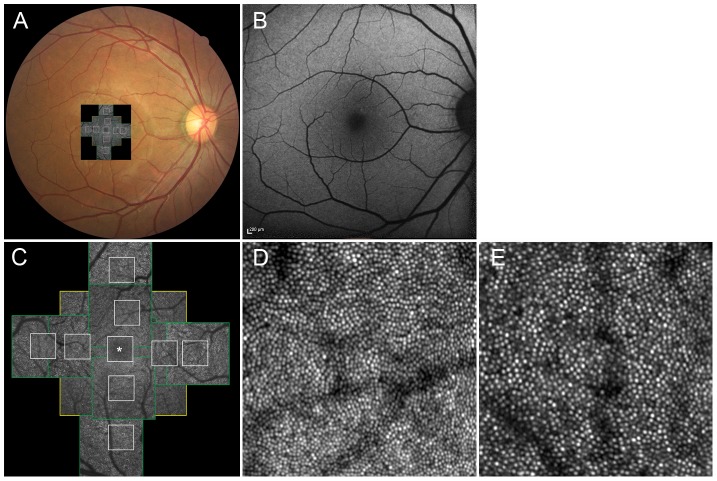
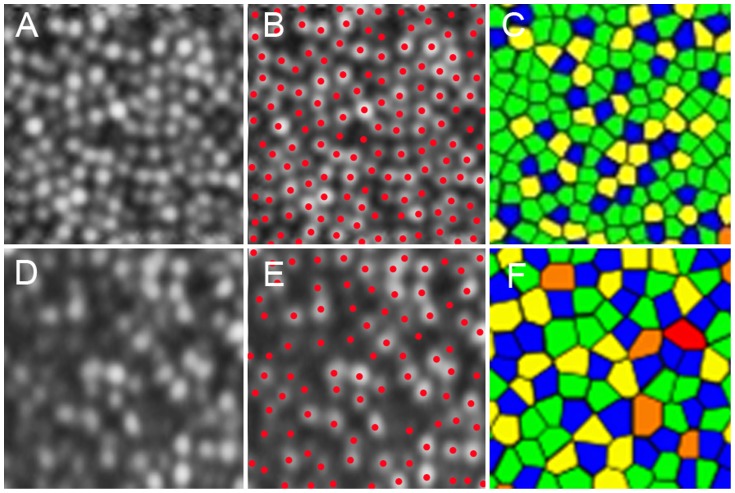
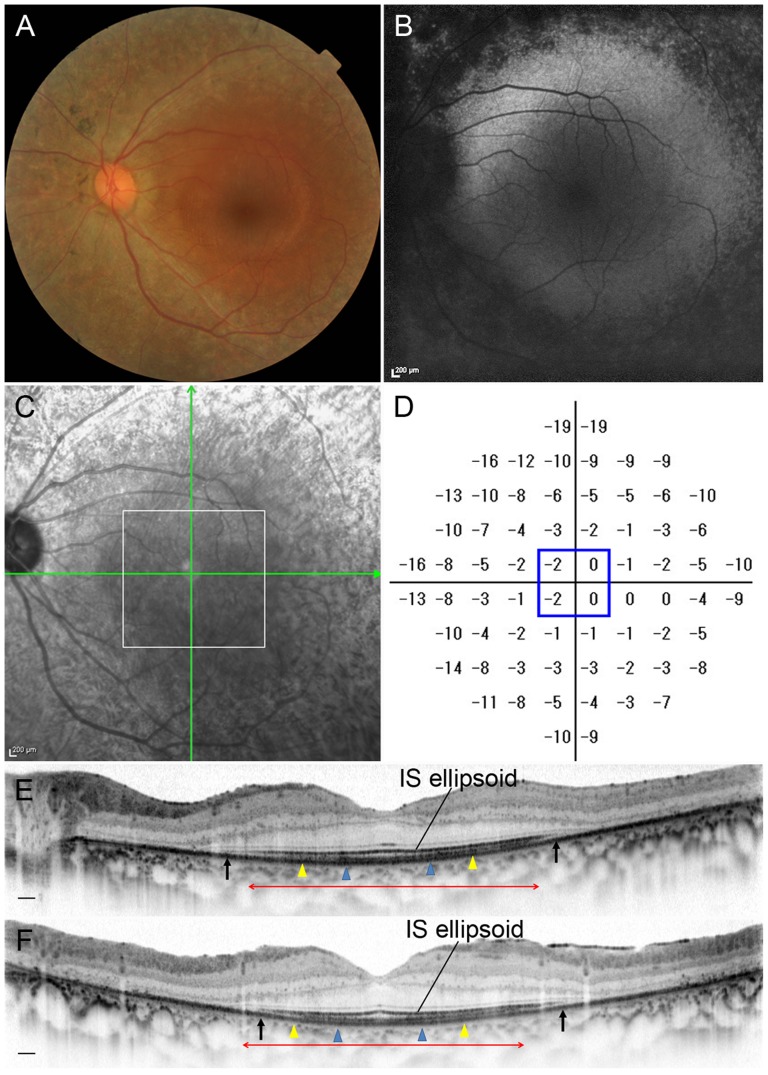
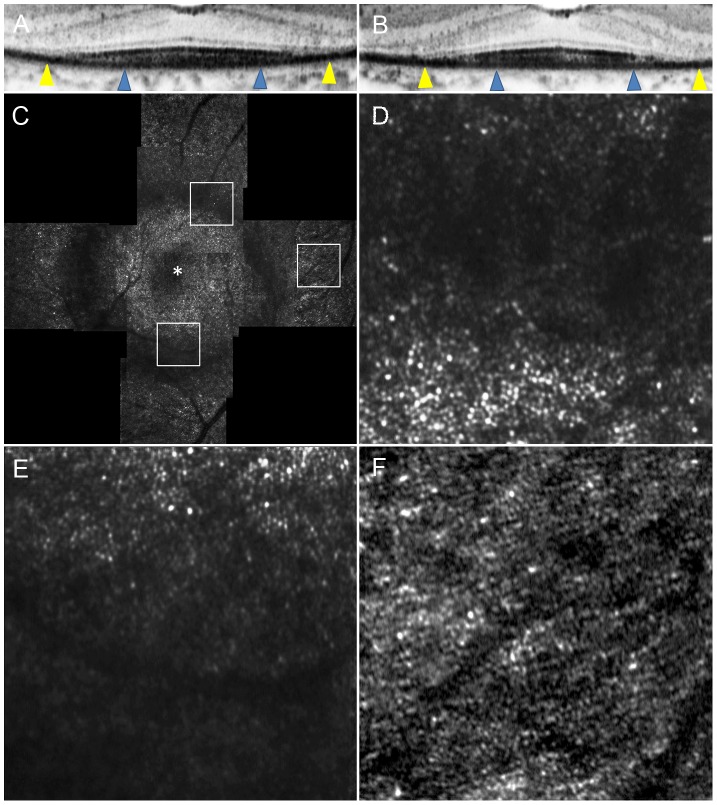
Methods: Fourteen eyes of 14 patients with RP (best-corrected visual acuity 20/20 or better) and 12 eyes of 12 volunteers underwent a full ophthalmologic examination, fundus autofluorescence, spectral-domain optical coherence tomography (SD-OCT), and imaging with a prototype AO-SLO system. Cone density and spatial organization of the cone mosaic were assessed using AO-SLO images.

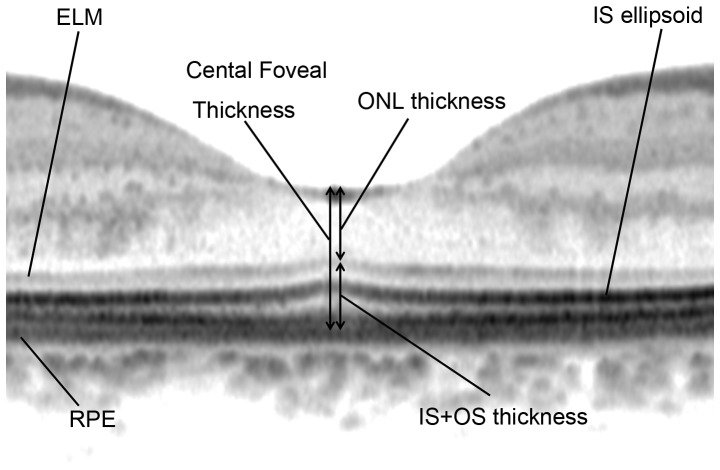
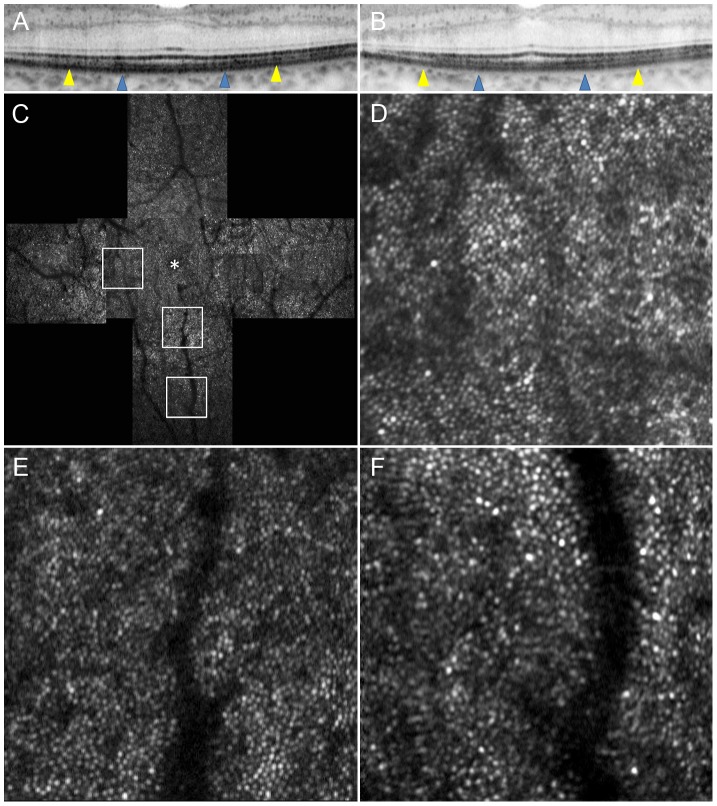
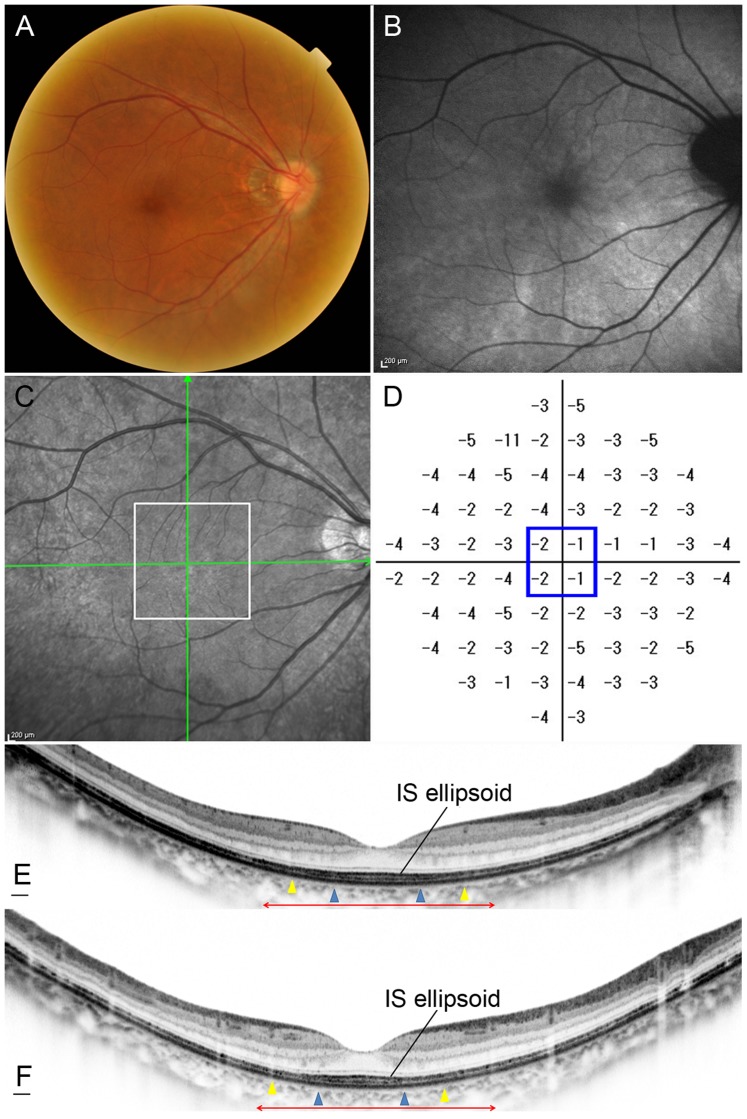
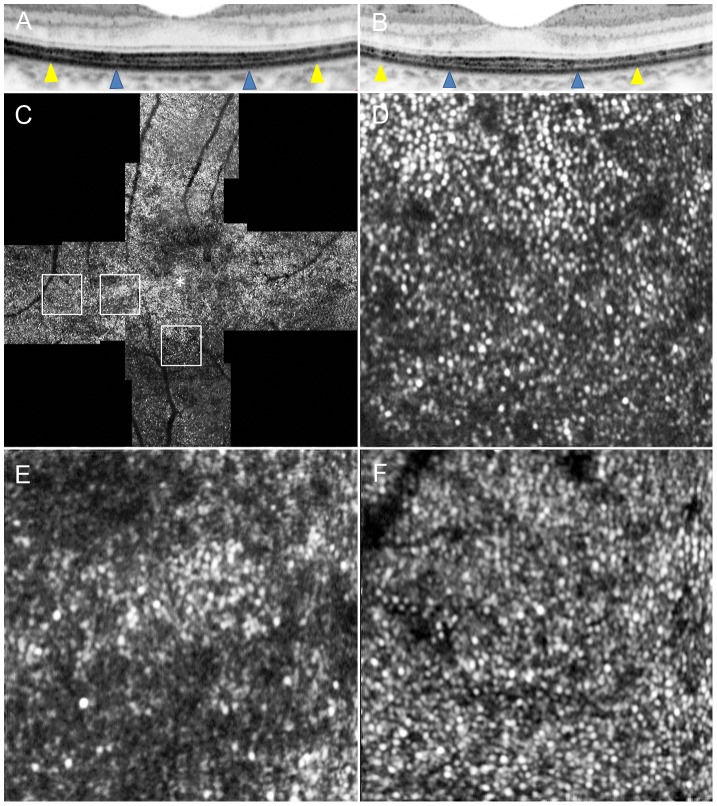
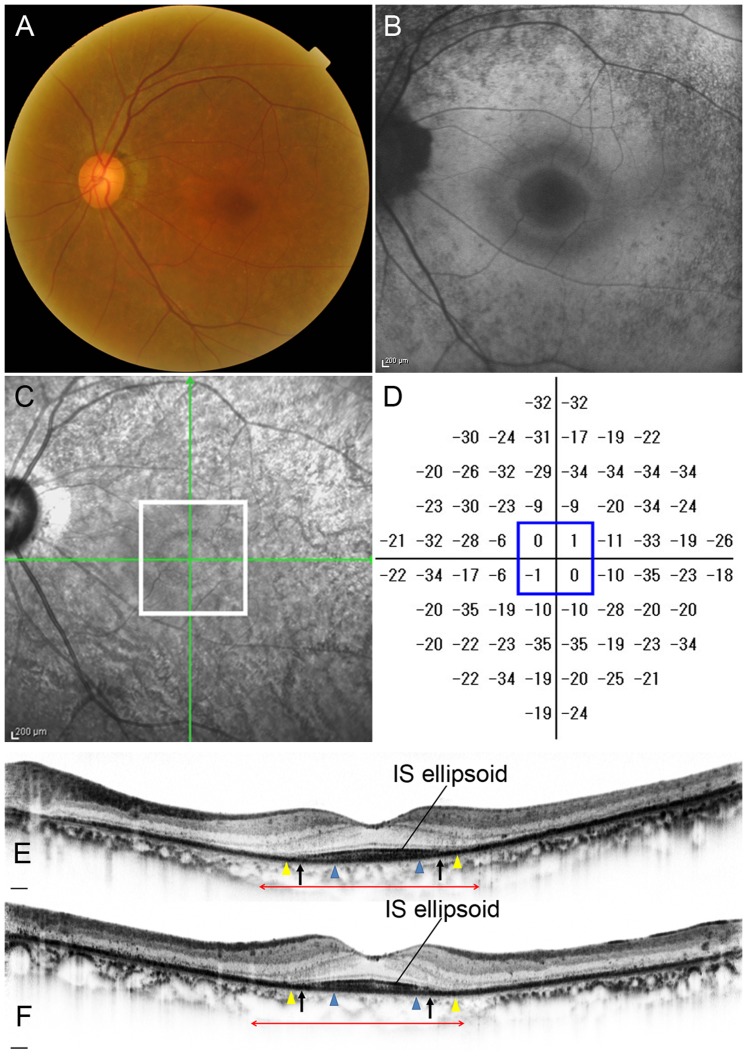
Results: In 3 eyes with RP and preserved central vision, cones formed a mostly regular mosaic pattern with small patchy dark areas, and in 10 eyes, the cone mosaic patterns were less regular, and large dark regions with missing cones were apparent. Only one eye with RP demonstrated a normal, regular cone mosaic pattern. In eyes with RP, cone density was significantly lower at 0.5 mm and 1.0 mm from the center of the fovea compared to normal eyes (P<0.001 and 0.021, respectively). At 0.5 mm and 1.0 mm from the center of the fovea, a decreased number of cones had 6 neighbors in eyes with RP (P = 0.002 for both). Greater decrease in cone density was related to disruption of the photoreceptor inner segment (IS) ellipsoid band on SD-OCT images (P = 0.044); however, dark regions were seen on AO-SLO even in areas of continuous IS ellipsoid on SD-OCT. Decreased cone density correlated thinner outer nuclear layer (P = 0.029) and thinner inner segment and outer segment thickness (P = 0.011) on SD-OCT.

Conclusions: Cone density is decreased and the regularity of the cone mosaic spatial arrangement is disrupted in eyes with RP, even when visual acuity and foveal sensitivity are good. AO-SLO imaging is a sensitive quantitative tool for detecting photoreceptor abnormalities in eyes with RP.


Conflict of interest statement

Competing Interests: This study was supported in part by Canon Inc. Canon Inc. has provided a prototype of AO-SLO system to the authors institution. This does not alter the authors' adherence to all the PLOS ONE policies on sharing data and materials.

Figures

Figure 1
Figure 1. Normal cone photoreceptors.
(A) Adaptive optics scanning laser ophthalmoscopy (AO-SLO) image registered on color fundus photograph. (B) Fundus autofluorescence (FAF) imaging. (C) Montage of a series of high-resolution images from the central fovea outward to 1.5 mm from the center of the fovea, obtained by AO-SLO. Asterisk = foveal center. First, 3 different field of view images (L [yellow box]: 1700×1700 µm, M [green box]: 820×820 µm, S [white box]: 340×340 µm) centered on the center of the fovea were obtained, followed by 2 field of view images (M and S) centered 0.5 mm and 1.0 mm from the center of the fovea at each direction (superior, nasal, inferior, temporal) (D and E) Representative images of areas 0.5 mm (D) and 1.0 mm (E) from the center of the fovea (340 µm×340 µm area).
Figure 2
Figure 2. Cone labeling and cone density/arrangement measurement.
(A) A cone mosaic image 0.5 mm from the center of the fovea in a normal eye. (B) Cone labeling results. (C) Voronoi diagram. The colors indicate the number of sides of each Voronoi polygon (pink, 4; blue, 5; green, 6; yellow, 7; and orange, 8). (D) A cone mosaic image 0.5 mm from the center of the fovea in an eye with retinitis pigmentosa (RP). (E) Cone labeling results. (F) Voronoi diagram. The colors indicate the number of sides of each Voronoi polygon (pink, 4; blue, 5; green, 6; yellow, 7; and orange, 8). The cone densities are 27,275 and 13,102 cones/mm2 in the normal eye and the eye with RP, respectively. Proportions of 6-sided Voronoi polygons were 54.1% and 40.0% in the normal eye and the eye with RP, respectively. The ratio of observed average nearest-neighbor distance (NND) for each subject divided by expected NND was 0.795 and 0.723 in the normal eye and the eye with RP, respectively.
Figure 3
Figure 3. Spectral-domain optical coherence tomography measurement.
Measurements included the thickness of the outer nuclear layer (ONL), which was measured between the vitreoretinal interface and external limiting membrane (ELM), the photoreceptor inner segment and outer segment (IS+OS) thickness, measured between the ELM and retinal pigment epithelium (RPE), and the total central foveal thickness.
Figure 4
Figure 4. Retinitis Pigmentosa Case (Case 8).
Images of the left eye of a 33-year-old man with RP (Case 8). Snellen equivalent best-corrected visual acuity (BCVA) was 20/15. (A) Fundus photograph shows attenuation of retinal vessels and mottling and granularity of the retinal pigment epithelium. (B) FAF image shows hypofluorescenct lesions outside the macula, but normal within the macula. (C) Infrared image with green arrows indicating the directions of scans shown in D and E, and a white box indicating the area scanned by AO-SLO. (D) Total deviation of Humphrey Field Analyzer (10-2 SITA standard program). Blue box indicates the central 4 points. (E) Horizontal SD-OCT line scan through the fovea. (F) Vertical SD-OCT line scan through the fovea. Blue arrowheads indicate 0.5 mm from the center of the fovea, and yellow arrowheads indicate 1.0 mm area from the center of the fovea. IS ellipsoid is remaining in the area between arrows. Red double-headed arrows indicate the area corresponding to the area scanned by AO-SLO.
Figure 5
Figure 5. Adaptive Optics Scanning Laser Ophthalmoscopy Image of Case 8.
(A) OCT image in a high magnification view of horizontal scan corresponding to the area scanned by AO-SLO. (B) OCT image in a high magnification view of vertical scan corresponding to the area scanned by AO-SLO. Blue arrowheads indicate 0.5 mm from the center of the fovea, and yellow arrowheads indicate 1.0 mm area from the center of the fovea. (C) AO-SLO montage image. The images show cones with a mostly regular mosaic pattern with small dark areas. Small dark areas are seen even in the area where the IS ellipsoid is continuous on SD-OCT (Fig. 4). (D) A high-magnification image at 0.5 mm in the nasal direction from the center of the fovea. (E) A high-magnification image at 0.5 mm in the inferior direction from the center of the fovea. (F) A high-magnification image at 1.0 mm in the inferior direction from the center of the fovea. The asterisk indicates the foveal center.
Figure 6
Figure 6. Retinitis Pigmentosa Case (Case 14).
Images of the right eye of a 35-year-old female with RP (Case 14). Snellen equivalent BCVA was 20/15. (A) Fundus photograph shows attenuation of retinal vessels and mottling and granularity of the retinal pigment epithelium. (B) FAF image shows swirls of hyperautofluorescence in the macula. (C) Infrared image with green arrows indicating the directions of scans shown in E and F, and a white box indicating the area scanned by AO-SLO. (D) Total deviation of Humphrey Field Analyzer (10-2 SITA standard program). Blue box indicates the central 4 points. (E) Horizontal SD-OCT line scan through the fovea. (F) Vertical SD-OCT line scan through the fovea. Blue arrowheads indicate 0.5 mm from the center of the fovea, and yellow arrowheads indicate 1.0 mm from the center of the fovea. Note that the IS ellipsoid is almost continuous in each scan. Red double-headed arrows indicate the area corresponding to the area scanned by AO-SLO.
Figure 7
Figure 7. Adaptive Optics Scanning Laser Ophthalmoscopy Image of Case 14.
Images of Case 14. (A) OCT image in a high magnification view of horizontal scan corresponding to the area scanned by AO-SLO. (B) OCT image in a high magnification view of vertical scan corresponding to the area scanned by AO-SLO. Blue arrowheads indicate 0.5 mm from the center of the fovea, and yellow arrowheads indicate 1.0 mm area from the center of the fovea. (C) AO-SLO images of Case 14. The images show cones with patchy dark areas representing cone loss. Dark areas are seen even in the area where the IS ellipsoid is continuous on SD-OCT (Fig. 6). (D) A high-magnification image at 0.5 mm in the inferior direction from the center of the fovea. (E) A high-magnification image at 0.5 mm in the temporal direction from the center of the fovea. (D) A high-magnification image at 1.0 mm in the temporal direction from the center of the fovea. The asterisk indicates the foveal center.
Figure 8
Figure 8. Retinitis Pigmentosa Case (Case 12).
Images of the left eye of a 63-year-old female with RP (Case 12). Snellen equivalent BCVA was 20/15. (A) Fundus photograph shows attenuation of retinal vessels and mottling and granularity of the retinal pigment epithelium. (B) FAF image shows a hyperautofluorescent ring surrounded by a hypoautofluorescent ring in the macula. (C) Infrared image with green arrows indicating the directions of scans shown in E and F, and a white box indicating the area scanned by AO-SLO. (D) Total deviation of Humphrey Field Analyzer (10-2 SITA standard program). Blue box indicates the central 4 points. (E) Horizontal SD-OCT line scan through the fovea. (F) Vertical SD-OCT line scan through the fovea. Blue arrowheads indicate 0.5 mm from the center of the fovea, and yellow arrowheads indicate 1.0 mm from the center of the fovea. The IS ellipsoid is remaining in the area between arrows. Red double-headed arrows indicate the area corresponding to the area scanned by AO-SLO.
Figure 9
Figure 9. Adaptive Optics Scanning Laser Ophthalmoscopy Image of Case 12.
Images of Case 12. (A) OCT image in a high magnification view of horizontal scan corresponding to the area scanned by AO-SLO. (B) OCT image in a high magnification view of vertical scan corresponding to the area scanned by AO-SLO. Blue arrowheads indicate 0.5 mm from the center of the fovea, and yellow arrowheads indicate 1.0 mm area from the center of the fovea. (C) AO-SLO montage images of Case 12. The images show a large dark annular lesion (arrows) where cones are missing, which corresponds to the area where IS ellipsoid is disrupted on SD-OCT (Fig. 8). (D) A high-magnification image at 0.5 mm in the superior direction from the center of the fovea. (E) A high-magnification image at 0.5 mm in the inferior direction from the center of the fovea. (F) A high-magnification image at 1.0 mm in the temporal direction from the center of the fovea. The asterisk indicates the foveal center.

References

    1. Berson EL (1993) Retinitis pigmentosa. The Friedenwald Lecture. Invest Ophthalmol Vis Sci 34: 1659–1676. - PubMed
    1. Hartong DT, Berson EL, Dryja TP (2006) Retinitis pigmentosa. Lancet 368: 1795–1809. - PubMed
    1. Grover S, Fishman GA, Anderson RJ, Alexander KR, Derlacki DJ (1997) Rate of visual field loss in retinitis pigmentosa. Ophthalmology 104: 460–465. - PubMed
    1. Hamada S, Yoshida K, Chihara E (2000) Optical coherence tomography images of retinitis pigmentosa. Ophthalmic Surg Lasers 31: 253–256. - PubMed
    1. Rumen F, Souied E, Oubraham H, Coscas G, Soubrane G (2001) [Optical coherence tomography in the follow up of macular edema treatment in retinitis pigmentosa]. J Fr Ophtalmol 24: 854–859. - PubMed

Publication types

LinkOut - more resources