

Modelling the effects of prey size and distribution on prey capture rates of two sympatric marine predators
- PMID: 24260318
- PMCID: PMC3829866
- DOI: 10.1371/journal.pone.0079915
Modelling the effects of prey size and distribution on prey capture rates of two sympatric marine predators
Abstract
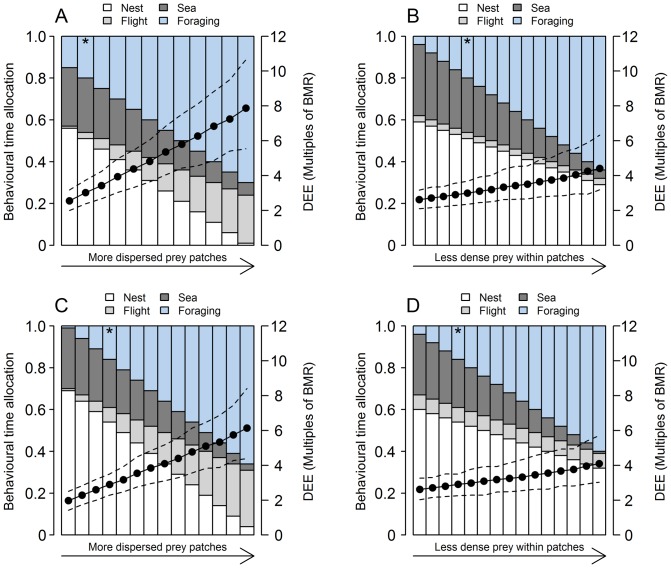
Understanding how prey capture rates are influenced by feeding ecology and environmental conditions is fundamental to assessing anthropogenic impacts on marine higher predators. We compared how prey capture rates varied in relation to prey size, prey patch distribution and prey density for two species of alcid, common guillemot (Uria aalge) and razorbill (Alca torda) during the chick-rearing period. We developed a Monte Carlo approach parameterised with foraging behaviour from bird-borne data loggers, observations of prey fed to chicks, and adult diet from water-offloading, to construct a bio-energetics model. Our primary goal was to estimate prey capture rates, and a secondary aim was to test responses to a set of biologically plausible environmental scenarios. Estimated prey capture rates were 1.5 ± 0.8 items per dive (0.8 ± 0.4 and 1.1 ± 0.6 items per minute foraging and underwater, respectively) for guillemots and 3.7 ± 2.4 items per dive (4.9 ± 3.1 and 7.3 ± 4.0 items per minute foraging and underwater, respectively) for razorbills. Based on species' ecology, diet and flight costs, we predicted that razorbills would be more sensitive to decreases in 0-group sandeel (Ammodytes marinus) length (prediction 1), but guillemots would be more sensitive to prey patches that were more widely spaced (prediction 2), and lower in prey density (prediction 3). Estimated prey capture rates increased non-linearly as 0-group sandeel length declined, with the slope being steeper in razorbills, supporting prediction 1. When prey patches were more dispersed, estimated daily energy expenditure increased by a factor of 3.0 for guillemots and 2.3 for razorbills, suggesting guillemots were more sensitive to patchier prey, supporting prediction 2. However, both species responded similarly to reduced prey density (guillemot expenditure increased by 1.7; razorbill by 1.6), thus not supporting prediction 3. This bio-energetics approach complements other foraging models in predicting likely impacts of environmental change on marine higher predators dependent on species-specific foraging ecologies.
Conflict of interest statement
Figures

References
-
- Irons DB (1998) Foraging area fidelity of individual seabirds in relation to tidal cycles and flock feeding. Ecology 79: 647–655.
-
- Xavier JC, Croxall JP, Trathan PN, Wood AG (2003) Feeding strategies and diets of breeding grey-headed and wandering albatrosses at South Georgia. Mar Biol 143: 221–232.
-
- Yen PPW, Huettmann F, Cooke F (2004) A large-scale model for at-sea distribution and abundance of Marbled Murrelets (Brachyramphus marmoratus) during the breeding season in coastal British Columbia, Canada. Ecol Modell 171: 395–413.
-
- Grecian WJ, Witt MJ, Attrill MJ, Bearhop S, Godley BJ, et al. (2012) A novel projection technique to identify important at-sea areas for seabird conservation: An example using Northern gannets breeding in the North East Atlantic. Biol Conserv 156: 43–52.
-
- Barrett RT, Camphuysen CJ, Anker-Nilssen T, Chardine JW, Furness RW, et al. (2007) Diet studies of seabirds: a review and recommendations. ICES J Mar Sci 64: 1675–1691.
Publication types
MeSH terms
LinkOut - more resources
Full Text Sources
Other Literature Sources
