. 2013 Nov 15;8(11):e80845.
doi: 10.1371/journal.pone.0080845. eCollection 2013.

Large-scale information flow in conscious and unconscious states: an ECoG study in monkeys

Affiliations

Large-scale information flow in conscious and unconscious states: an ECoG study in monkeys

Toru Yanagawa et al. PLoS One. .

Erratum in

  • PLoS One. 2014;9(3):e91438

Abstract

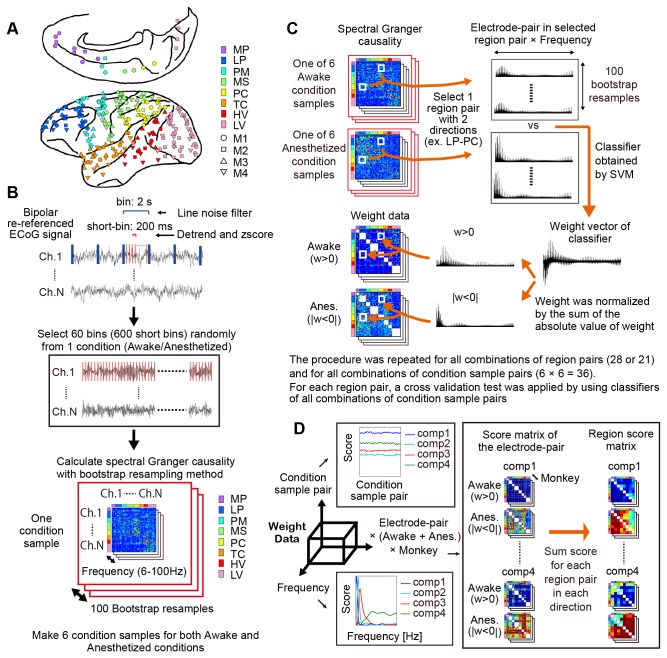
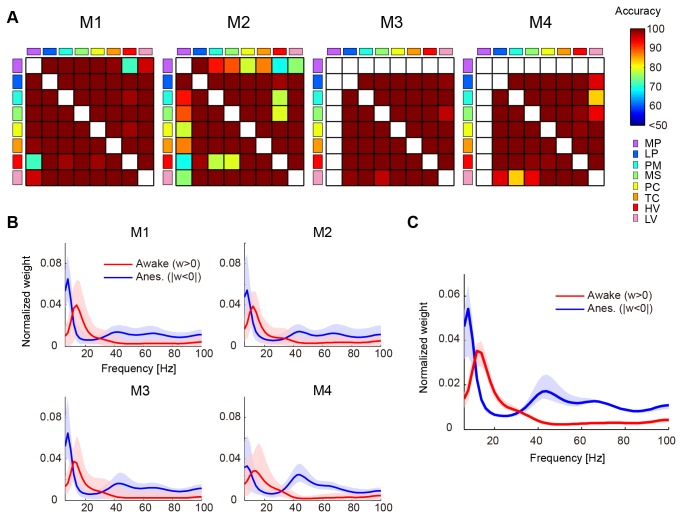
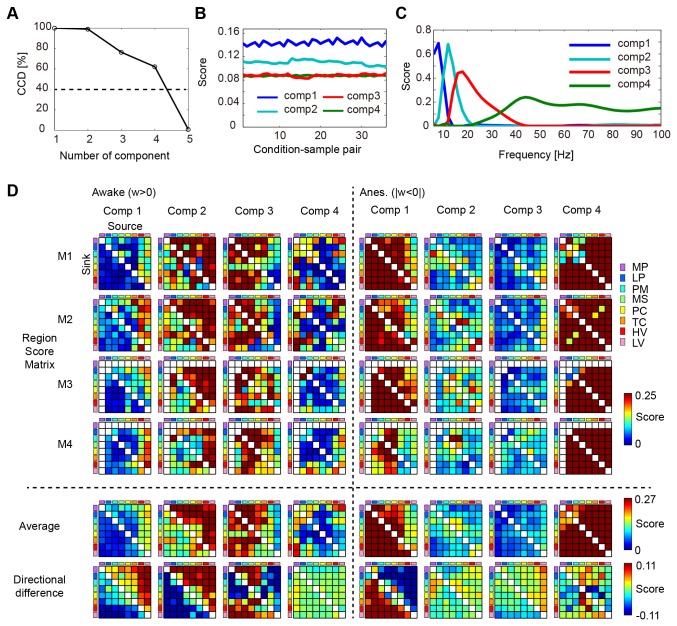
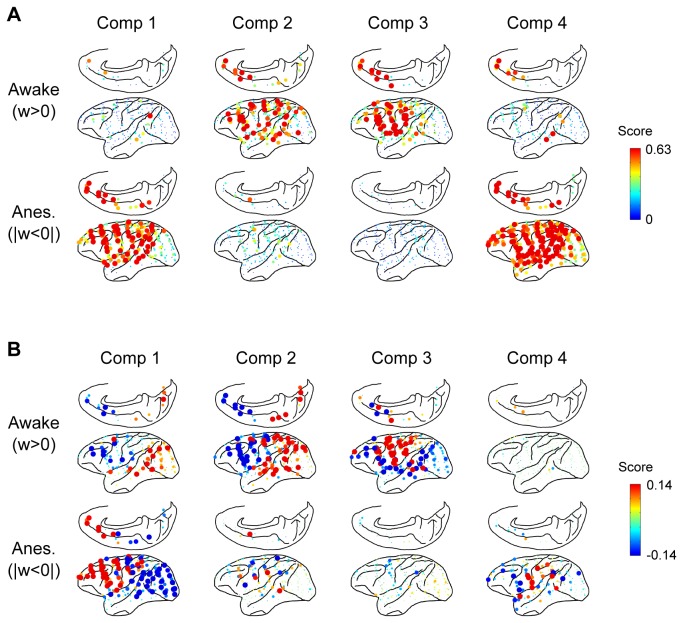
Consciousness is an emergent property of the complex brain network. In order to understand how consciousness is constructed, neural interactions within this network must be elucidated. Previous studies have shown that specific neural interactions between the thalamus and frontoparietal cortices; frontal and parietal cortices; and parietal and temporal cortices are correlated with levels of consciousness. However, due to technical limitations, the network underlying consciousness has not been investigated in terms of large-scale interactions with high temporal and spectral resolution. In this study, we recorded neural activity with dense electrocorticogram (ECoG) arrays and used the spectral Granger causality to generate a more comprehensive network that relates to consciousness in monkeys. We found that neural interactions were significantly different between conscious and unconscious states in all combinations of cortical region pairs. Furthermore, the difference in neural interactions between conscious and unconscious states could be represented in 4 frequency-specific large-scale networks with unique interaction patterns: 2 networks were related to consciousness and showed peaks in alpha and beta bands, while the other 2 networks were related to unconsciousness and showed peaks in theta and gamma bands. Moreover, networks in the unconscious state were shared amongst 3 different unconscious conditions, which were induced either by ketamine and medetomidine, propofol, or sleep. Our results provide a novel picture that the difference between conscious and unconscious states is characterized by a switch in frequency-specific modes of large-scale communications across the entire cortex, rather than the cessation of interactions between specific cortical regions.


Conflict of interest statement

Competing Interests: The authors have declared that no competing interests exist.

Figures

Figure 1
Figure 1. Schematic explanation of method.
A: The bipolar re-referenced ECoG electrode arrays on the left cortical surface of 4 monkeys (M1-M4). Marker colors represent cortical regions, and shapes of markers represent monkeys. MP: Medial prefrontal cortex LP: Lateral prefrontal cortex, PM: Premotor cortex, MS: Primary motor and somatosensory cortices, PC: Parietal cortex, TC: Temporal cortex, HV: Higher visual cortex and LC: Lower visual cortex. The positions of the ECoG electrode in monkeys M1, M3, and M4 were manually remapped on the brain of monkey M2 by using the sulci as remapping references. B: Preprocessing of ECoG signals for spectral Granger causality and its data structure. For preprocessing of the ECoG signal, bipolar re-reference, line noise filter, detrend, and z-score transformation were applied. Next, 120-sec time length data was prepared as a condition sample from the data set collected on different experimental days. One hundred bootstrap resamples of spectral Granger causalities were calculated from 1 condition sample. Six condition samples were prepared for the awake and anesthetized conditions. C: The procedure for obtaining the weight data for the awake and anesthetized conditions. SVM was generated to classify bootstrap resamples of spectral Granger causality between the awake and anesthetized conditions for all combinations of region pairs and for all combinations of condition sample pairs. Weights of the classifier for all combinations of region pairs were separated for the awake and anesthetized conditions based on their sign and were integrated in the weight data. D: By using PARAFAC, network components were extracted from the global pattern of the weight data. The weight data of 4 monkeys were combined and aligned to 3 dimensions, 1) condition sample pairs, 2) frequency, and 3) electrode pairs of all combinations of region pairs for awake and anesthetized. After the deconstruction, the components in each dimension had relative scores.
Figure 2
Figure 2. Accuracy of classifier between awake and anesthetized conditions and spectral distribution of classifier weight.
A: Accuracy of the classifier for all combinations of cortical region pairs for the 4 monkeys. White squares mean lack of data where no classifier was built. When the accuracy of a region pair was not significant, the accuracy was set to 50%. B: The distribution of normalized weights for the awake (red) and anesthetized (blue) conditions averaged for all combinations of cortical region pairs. For preprocessing, the weight data of each region pair was normalized by the sum of the absolute value of weight and was averaged for all combinations of condition sample pairs. The normalized weights were averaged for all combinations of cortical region pairs and are shown in the line. The range from minimum to maximum values in cortical region pairs is shown by the shading around the line. C: The distribution of averaged weights of region pairs for the awake (red) and anesthetized (blue) conditions for the 4 monkeys. The averaged distribution of the 4 monkeys is shown by a line plot, and the range from minimum to maximum values is indicated by the shading around the line.
Figure 3
Figure 3. Network components extracted from the global pattern of the weight data by using PARAFAC.
A: CCD for the number of components. The threshold was set to 40%. B: The scores for the dimension of condition sample pairs. C: The scores for the dimension of frequency. D: (M1-M4): The region score matrix for the awake and anesthetized conditions and for the 4 monkeys. (Average): The region score matrix was averaged for the 4 monkeys. (Directional difference): The difference of the scores between the 2 directions was calculated for each region pair.
Figure 4
Figure 4. Spatial distribution of electrodes for information outflow and inflow in 4 network components.
A: The distribution of electrode scores was summed for 2 interaction directions. The value was calculated for each component and for awake and anesthetized conditions. A high score indicated that the electrode had very high interaction with other electrodes. The values for the 4 monkeys were superimposed on 1 brain map. B: The distribution of electrode scores was summed for each interaction direction, and the difference between the 2 interaction directions was calculated for each component and for awake and anesthetized conditions. The red dot indicates that the information outflow of the electrode was larger than information inflow, and the blue dot indicates vice versa. The values for the 4 monkeys were superimposed on 1 brain map.
Figure 5
Figure 5. Similar accuracy of classifier and network component between ketamine–medetomidine and 3-LOC experiments.
A: Accuracy of the classifier to categorize the awake and LOC conditions for all combinations of cortical region pairs for monkeys M1 and M2. Figure format is the same as Figure 2A. B: Spatial-frequency correlations between components in the ketamine–medetomidine (K-M) experiment and that in the 3-LOC experiments. The correlation was calculated for monkeys M1 and M2 and for the awake and LOC conditions. The spatial-frequency correlation evaluated the similarity in pattern of components in the dimensions of frequency and electrode pairs.

References

    1. Seth AK, Dienes Z, Cleeremans A, Overgaard M, Pessoa L (2008) Measuring consciousness: relating behavioural and neurophysiological approaches. Trends Cogn Sci 12: 314-321. doi:10.1016/j.tics.2008.04.008. PubMed: 18606562. - DOI - PMC - PubMed
    1. Baars BJ (2002) The conscious access hypothesis: origins and recent evidence. Trends Cogn Sci 6: 47-52. doi:10.1016/S1364-6613(00)01819-2. PubMed: 11849615. - DOI - PubMed
    1. Tononi G, Edelman GM (1998) Consciousness and complexity. Science 282: 1846-1851. doi:10.1126/science.282.5395.1846. PubMed: 9836628. - DOI - PubMed
    1. Tononi G (2004) An information integration theory of consciousness. BMC Neurosci 5: 42. doi:10.1186/1471-2202-5-42. PubMed: 15522121. - DOI - PMC - PubMed
    1. White NS, Alkire MT (2003) Impaired thalamocortical connectivity in humans during general-anesthetic-induced unconsciousness. Neuroimage 19: 402-411. doi:10.1016/S1053-8119(03)00103-4. PubMed: 12814589. - DOI - PubMed

Publication types

LinkOut - more resources