. 2013 Nov 15;8(11):e80910.
doi: 10.1371/journal.pone.0080910. eCollection 2013.

Retinal cone photoreceptors of the deer mouse Peromyscus maniculatus: development, topography, opsin expression and spectral tuning

Affiliations

Retinal cone photoreceptors of the deer mouse Peromyscus maniculatus: development, topography, opsin expression and spectral tuning

Patrick Arbogast et al. PLoS One. .

Abstract

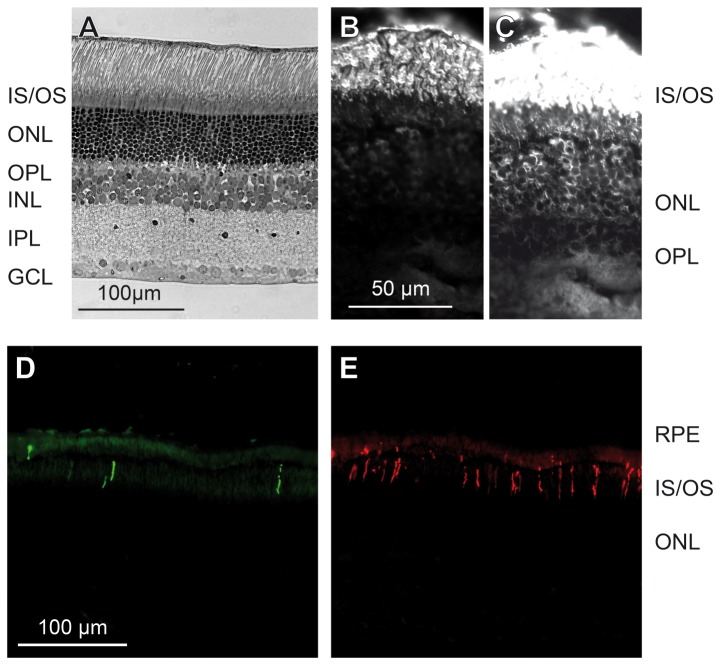
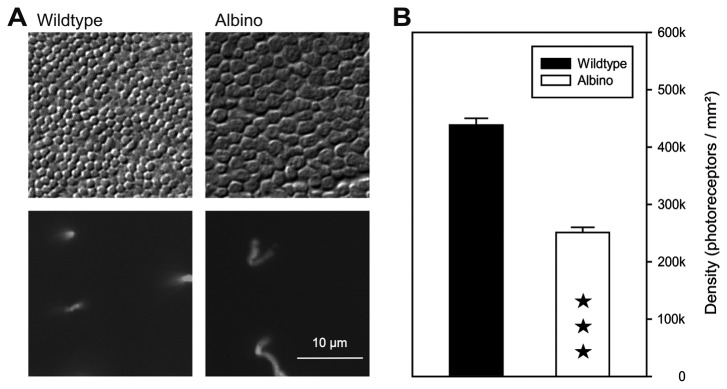
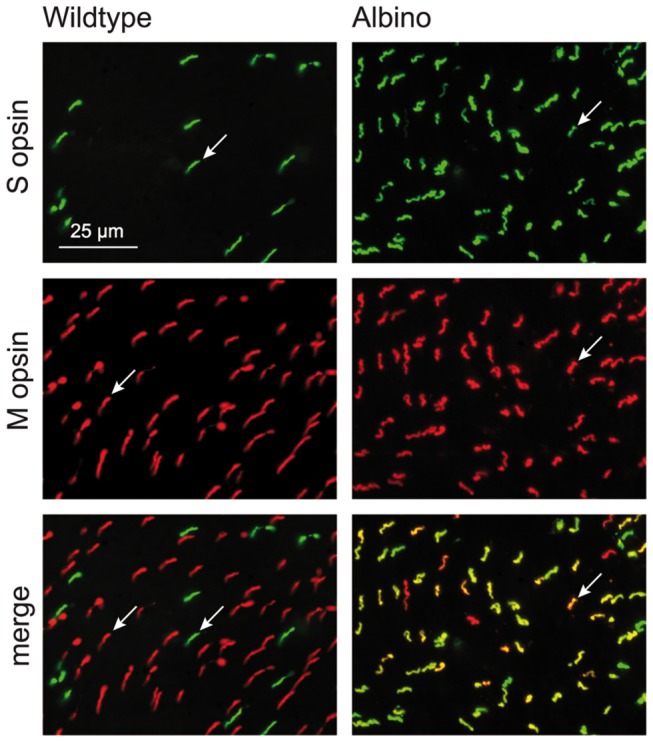
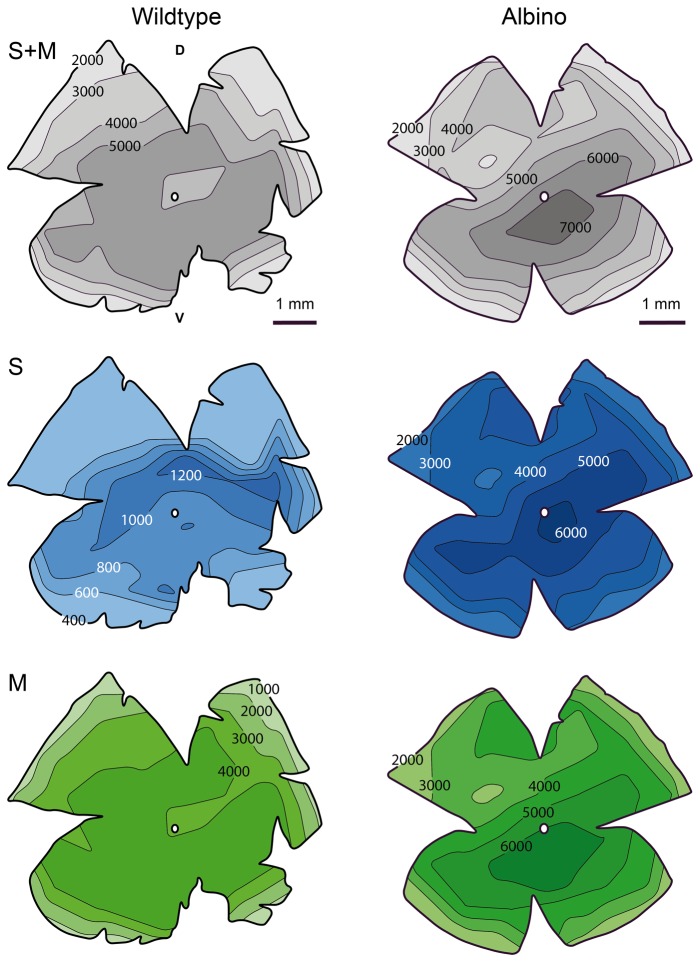
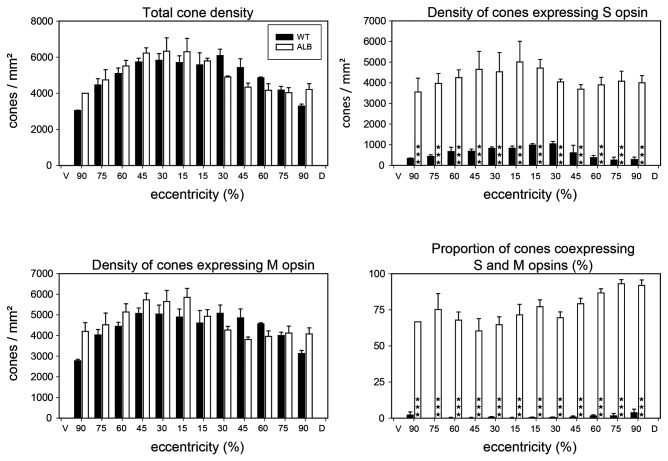
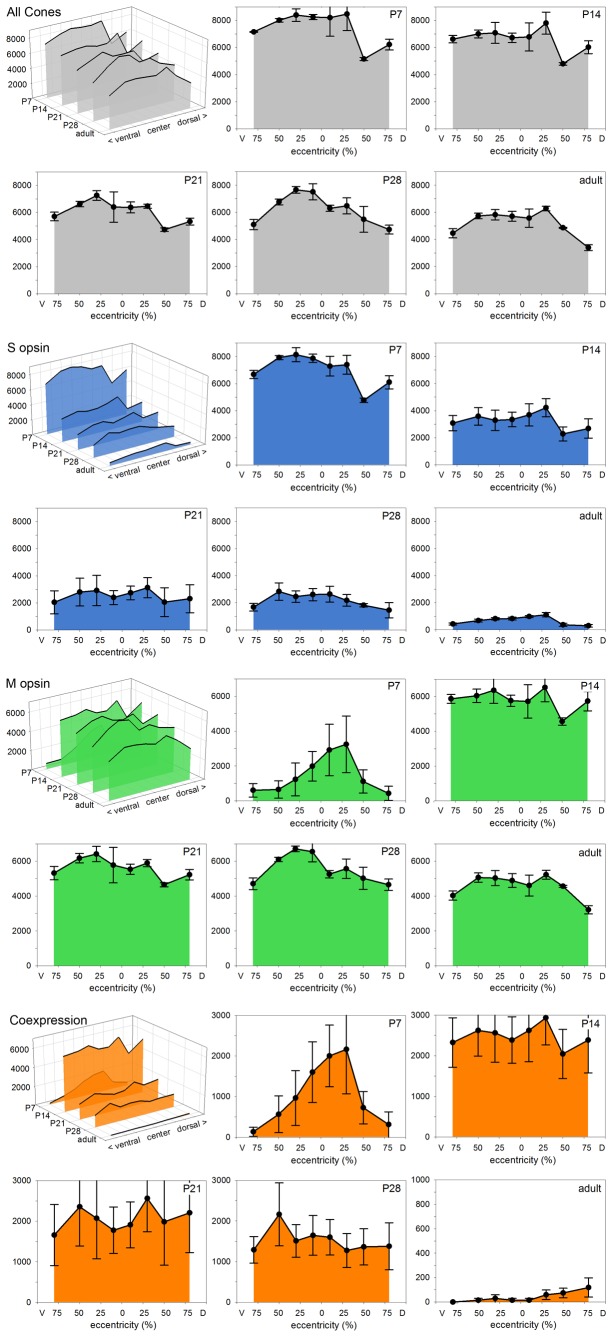
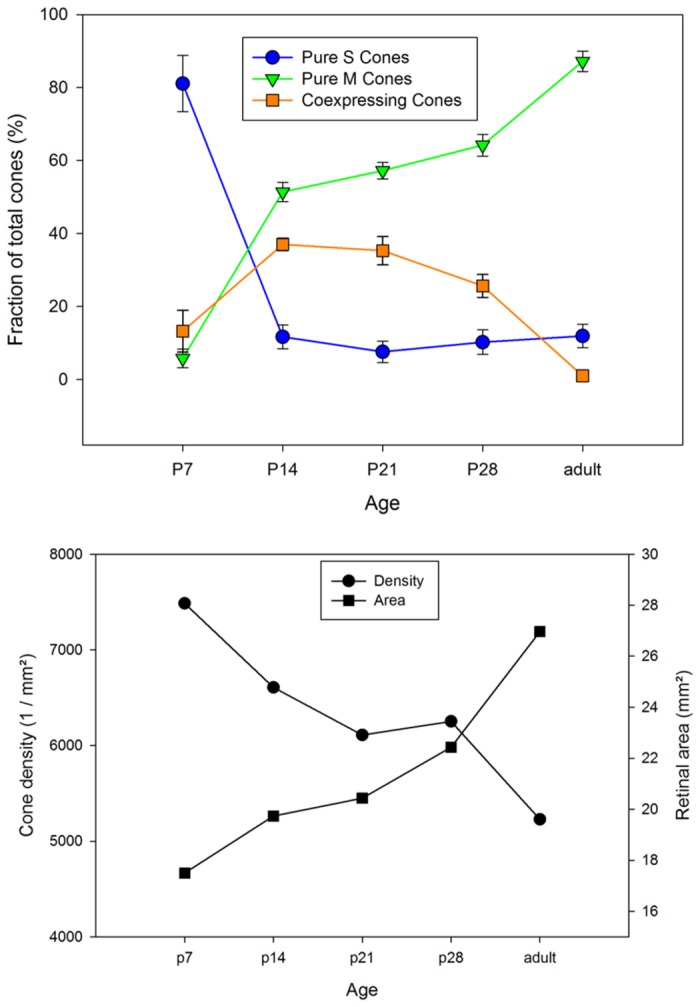
A quantitative analysis of photoreceptor properties was performed in the retina of the nocturnal deer mouse, Peromyscus maniculatus, using pigmented (wildtype) and albino animals. The aim was to establish whether the deer mouse is a more suitable model species than the house mouse for photoreceptor studies, and whether oculocutaneous albinism affects its photoreceptor properties. In retinal flatmounts, cone photoreceptors were identified by opsin immunostaining, and their numbers, spectral types, and distributions across the retina were determined. Rod photoreceptors were counted using differential interference contrast microscopy. Pigmented P. maniculatus have a rod-dominated retina with rod densities of about 450.000/mm(2) and cone densities of 3000-6500/mm(2). Two cone opsins, shortwave sensitive (S) and middle-to-longwave sensitive (M), are present and expressed in distinct cone types. Partial sequencing of the S opsin gene strongly supports UV sensitivity of the S cone visual pigment. The S cones constitute a 5-15% minority of the cones. Different from house mouse, S and M cone distributions do not have dorsoventral gradients, and coexpression of both opsins in single cones is exceptional (<2% of the cones). In albino P. maniculatus, rod densities are reduced by approximately 40% (270.000/mm(2)). Overall, cone density and the density of cones exclusively expressing S opsin are not significantly different from pigmented P. maniculatus. However, in albino retinas S opsin is coexpressed with M opsin in 60-90% of the cones and therefore the population of cones expressing only M opsin is significantly reduced to 5-25%. In conclusion, deer mouse cone properties largely conform to the general mammalian pattern, hence the deer mouse may be better suited than the house mouse for the study of certain basic cone properties, including the effects of albinism on cone opsin expression.


Conflict of interest statement

Competing Interests: The authors have declared that no competing interests exist.

Figures

Figure 1
Figure 1. Deer mouse retinal morphology and photoreceptors.
(A) Transverse 1µm section stained with toludine blue to show the retinal layers in Peromyscus maniculatus. (B) Vertical cryostat section immunolabeled for rod opsin, revealing a dense population of rod outer segments. (C) Same field as B, overexposed to show the weaker immunoreactivity of the rod somata. (D, E) Vertical cryostat section double-immunolabeled for S cone opsin (D) and M cone opsin (E), showing the outer segments of a substantial M cone population and a sparser S cone population. OS, IS, photoreceptor outer and inner segments; ONL, outer nuclear layer; OPL, outer plexiform layer; INL, inner nuclear layer; IPL, inner plexiform layer; GCL, ganglion cell layer; RPE, retinal pigment epithelium.
Figure 2
Figure 2. Photoreceptor differences between pigmented and albino deer mice.
(A) Top: flat view of photoreceptor inner segments in wildtype and albino animals, showing the larger IS diameter and lower density of the albino photoreceptors, differential interference contrast images. Bottom: cones in the same fields, combined immunofluorescence labeling for M and S opsin. The scale bar applies to all images. (B) Quantification of the photoreceptor densities in wildtype and albino. Counts were made at several positions across the retina (wildtype: 11 positions in 1 retina; albino: 6 positions in 2 retinae of 2 individuals; data given as mean and SEM. ★★★, difference statistically significant at p<0,001 (t-test).
Figure 3
Figure 3. Cone opsin expression in adult pigmented and albino deer mice.
Double immunofluorescence labeling for S and M opsin in flatmounted retinae, the focus is on the opsin-containing cone outer segments. Top: There is a sparse population of S opsin-expressing cones in the wildtype and a more numerous one in the albino. Middle: The populations of M opsin-expressing cones are similar in both genotypes. Bottom: Merge of the top and middle images shows that S and M cones form separate populations in the wildtype, whereas many cones coexpress both opsins in the albino (yellowish colors); cone examples are arrowed. The scale bar applies to all images.
Figure 4
Figure 4. Maps of cone densities in adult pigmented and albino deer mice.
The two columns each show three maps of the same retina, giving total cone density (top), S cone density (middle), and M cone density (bottom). Densities at the isodensity lines are cones/mm². The small circles in the center of the retinae indicate the optic nerve head. D, dorsal; V, ventral.
Figure 5
Figure 5. Quantitative comparison of cone densities and opsin expression in adult wildtype and albino deer mice.
The local densities of cones expressing M opsin, S opsin, or both, were determined along the dorso-ventral axis of the retina in three wildtype and three albino retinae, they are given as mean and SEM. The abscissa of each graph gives eccentricity as percentage of the distance between the optic nerve head (located at 0%) and the ventral (V) or dorsal (D) margin of the retina (located at 100%), respectively. Total cone density and the density of M opsin-expressing cones are similar in both genotypes and show a density decline from central to peripheral retina. In contrast, the density of S opsin-expressing cones is much higher in the albino than in the wildtype. This is because of the large proportion of albino cones that coexpress both opsins. ★★★, differences statistically significant at p<0,001 (two-way ANOVA & Bonferroni’s post-hoc test).
Figure 6
Figure 6. Postnatal development of cone opsin expression.
The four colored blocks show the development of cone properties along the dorso-ventral axis of the retina from postnatal day P7 to adulthood. Each block contains a 3D diagram summarizing the progression of a property across the retina and over time, and the individual diagrams for each time point. For each time point, the cones were counted in three wildtype retinae double-immunolabeled for M and S opsin, data points give mean values and SEM. Top block (grey): Total cone density shows a decline with age, because of retinal areal growth. Second block (blue): Density of S opsin-expressing cones. At P7 nearly all cones express S opsin, during subsequent retinal maturation the number of S opsin-expressing cones drops dramatically to adult values. Third block (green): The density of M opsin-expressing cones is low at P7 and is highest in the central retina that leads maturation. During subsequent maturation, the number of M opsin-expressing cones increases to adult values. Bottom block (orange): Density of cones coexpressing M and S opsin, comprising practically all M opsin-expressing cones at P7 and a decreasing proportion of the cones at later stages. All vertical axes give cone densities (cones/mm²), eccentricities are given as in Figure 5.
Figure 7
Figure 7. Postnatal changes of retinal size, cone density and opsin expression.
Top: Cone density decreases anti-parallel to postnatal retinal areal growth. This suggests that cones are neither born nor dying after P7. Cone densities are averages across retinae without regional differentiation, retinal area at each age is the mean of three retinae. Bottom: Postnatal changes in cone opsin expression. The cones start out by expressing S opsin, and most of them subsequently switch to M opsin expression. The fraction of cones that transiently coexpress both opsins peaks around P14 to P21.

References

    1. Joyner CP, Myrick LC, Crossland JP, Dawson WD (1998) Deer mice as laboratory animals. Ilar J 39: 322-330. doi:10.1093/ilar.39.4.322. PubMed: 11406688. - DOI - PubMed
    1. Shupe JM, Kristan DM, Austad SN, Stenkamp DL (2006) The eye of the laboratory mouse remains anatomically adapted for natural conditions. Brain Behav Evol 67: 39-52. doi:10.1159/000088857. PubMed: 16219997. - DOI - PMC - PubMed
    1. Ahnelt PK, Kolb H (2000) The mammalian photoreceptor mosaic-adaptive design. Prog Retin Eye Res 19: 711-777. doi:10.1016/S1350-9462(00)00012-4. PubMed: 11029553. - DOI - PubMed
    1. Peichl L (2005) Diversity of mammalian photoreceptor properties: Adaptations to habitat and lifestyle? Anat Rec A Discov Mol Cell Evol Biol 287A: 1001-1012. doi:10.1002/ar.a.20262. PubMed: 16200646. - DOI - PubMed
    1. Bowmaker JK (2008) Evolution of vertebrate visual pigments. Vision Res 48: 2022-2041. doi:10.1016/j.visres.2008.03.025. PubMed: 18590925. - DOI - PubMed

Publication types

MeSH terms

LinkOut - more resources