. 2013 Nov 19;8(11):e81004.
doi: 10.1371/journal.pone.0081004. eCollection 2013.

Development of NMDAR antagonists with reduced neurotoxic side effects: a study on GK11

Affiliations

Development of NMDAR antagonists with reduced neurotoxic side effects: a study on GK11

Delphine Vandame et al. PLoS One. .

Abstract

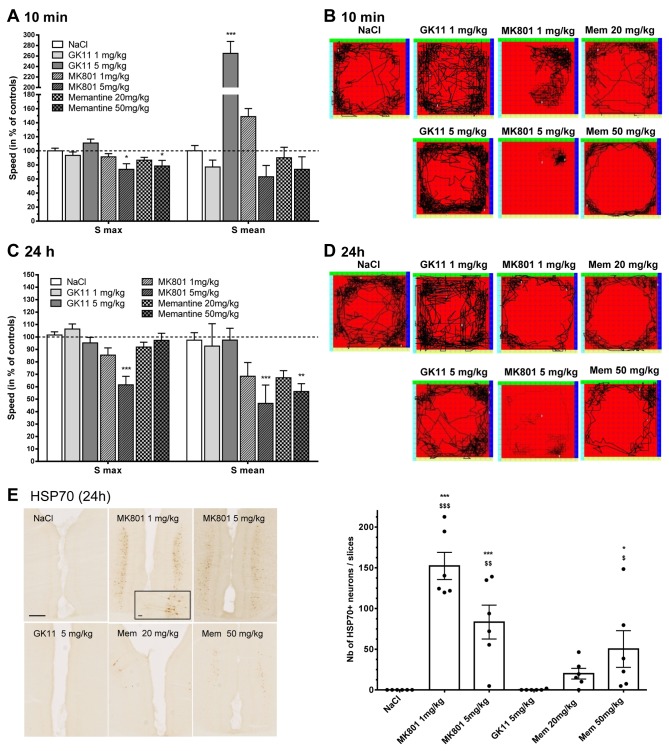
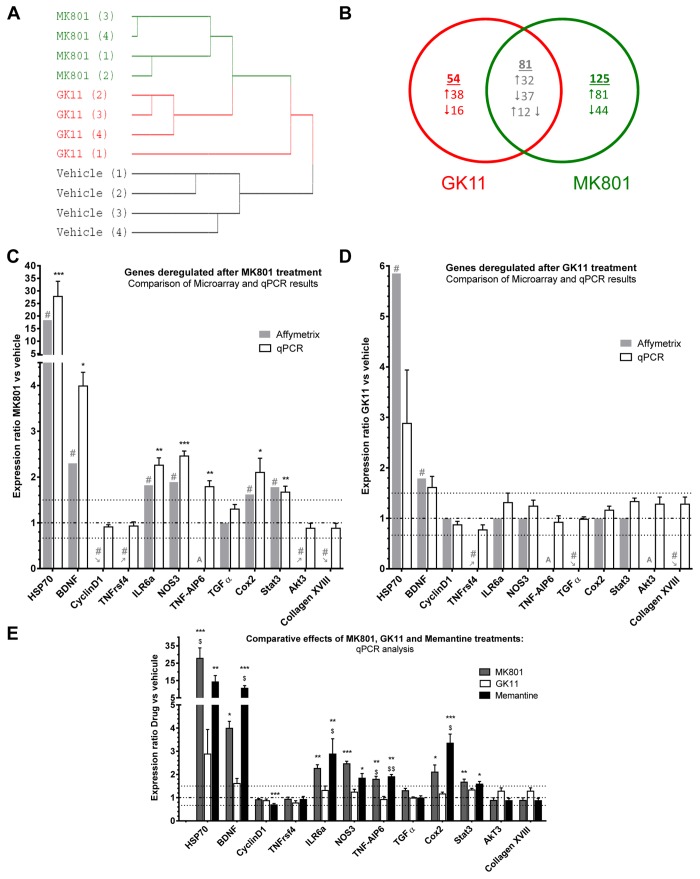
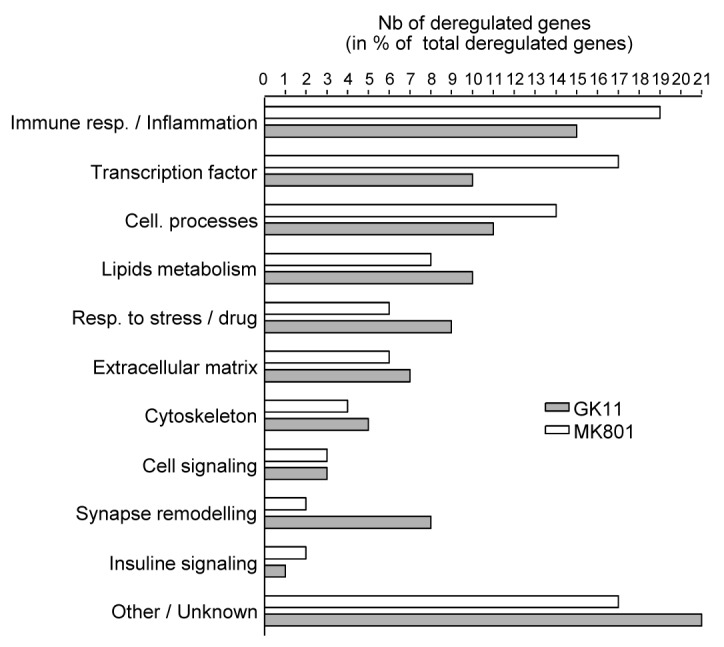
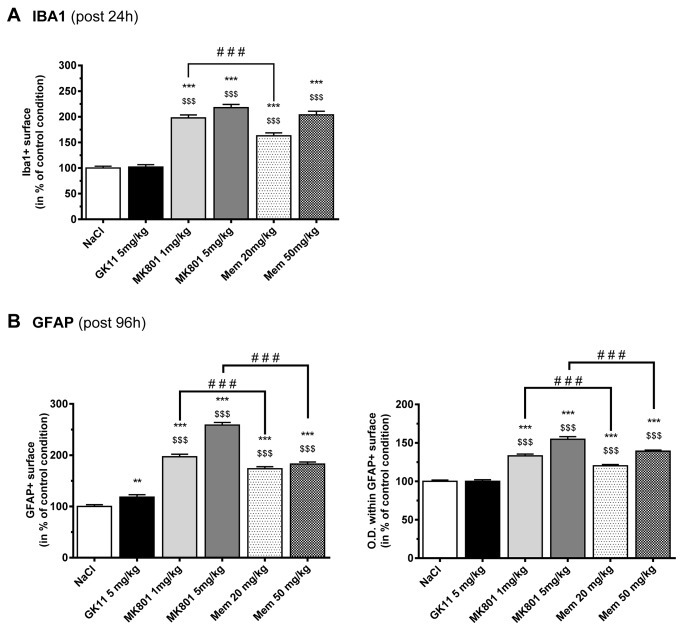
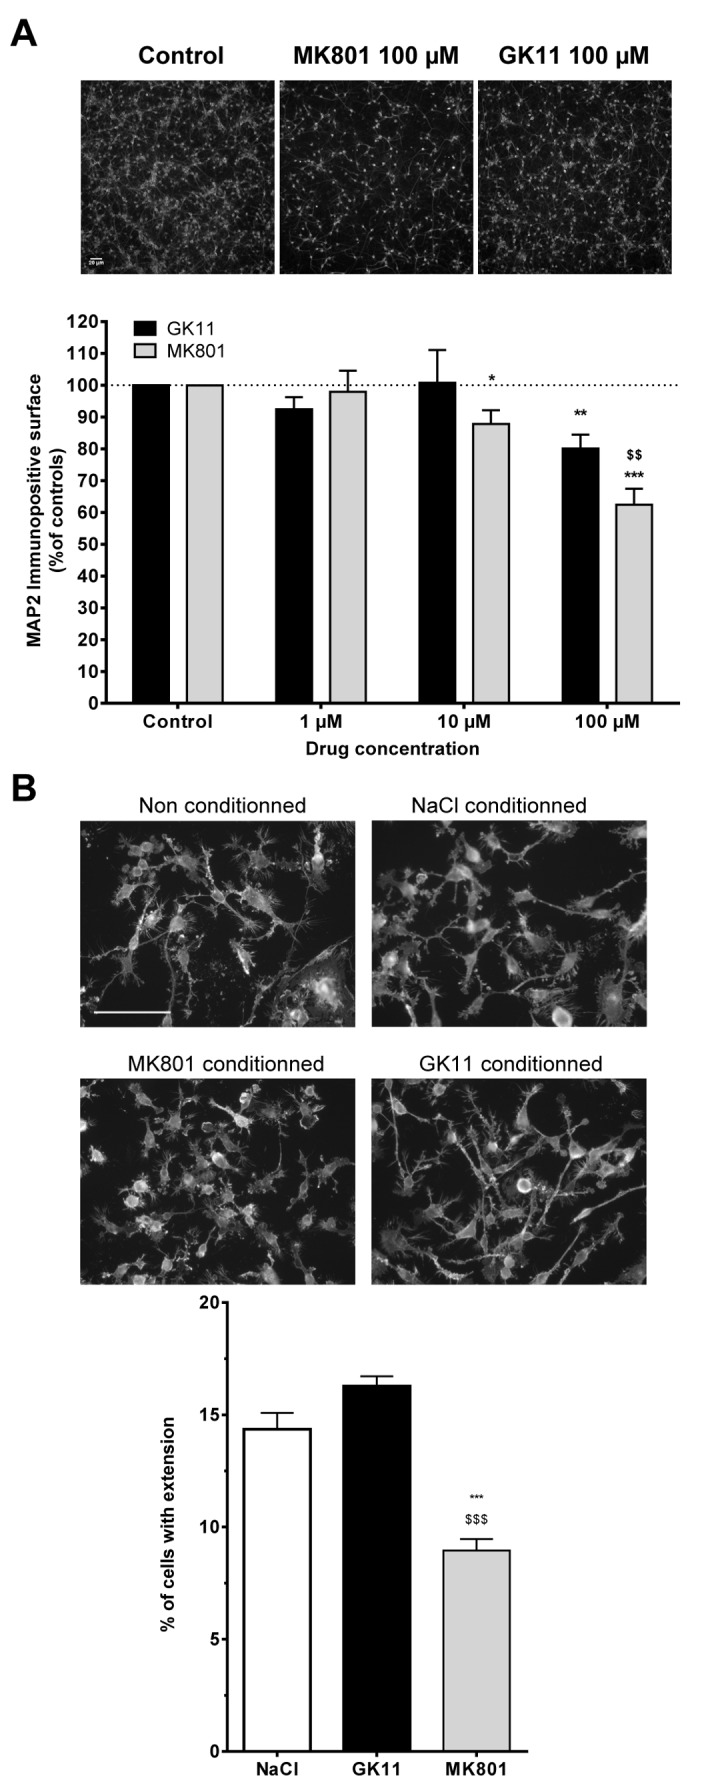
The NMDAR glutamate receptor subtype mediates various vital physiological neuronal functions. However, its excessive activation contributes to neuronal damage in a large variety of acute and chronic neurological disorders. NMDAR antagonists thus represent promising therapeutic tools that can counteract NMDARs' overactivation. Channel blockers are of special interest since they are use-dependent, thus being more potent at continuously activated NMDARs, as may be the case in pathological conditions. Nevertheless, it has been established that NMDAR antagonists, such as MK801, also have unacceptable neurotoxic effects. Presently only Memantine is considered a safe NMDAR antagonist and is used clinically. It has recently been speculated that antagonists that preferentially target extrasynaptic NMDARs would be less toxic. We previously demonstrated that the phencyclidine derivative GK11 preferentially inhibits extrasynaptic NMDARs. We thus anticipated that this compound would be safer than other known NMDAR antagonists. In this study we used whole-genome profiling of the rat cingulate cortex, a brain area that is particularly sensitive to NMDAR antagonists, to compare the potential adverse effects of GK11 and MK801. Our results showed that in contrast to GK11, the transcriptional profile of MK801 is characterized by a significant upregulation of inflammatory and stress-response genes, consistent with its high neurotoxicity. In addition, behavioural and immunohistochemical analyses confirmed marked inflammatory reactions (including astrogliosis and microglial activation) in MK801-treated, but not GK11-treated rats. Interestingly, we also showed that GK11 elicited less inflammation and neuronal damage, even when compared to Memantine, which like GK11, preferentially inhibits extrasynaptic NMDAR. As a whole, our study suggests that GK11 may be a more attractive therapeutic alternative in the treatment of CNS disorders characterized by the overactivation of glutamate receptors.


Conflict of interest statement

Competing Interests: The authors have the following interests. Marisa Teigell and Monica Prieto-Cappellini are employed by Neureva. The GK11 (cis(pip/me)-1-[1-(2-Thienyl)- 2-methylcyclohexyl]piperidine) used in this study was a generous gift from Expansia (France). There are no further patents, products in development or marketed products to declare. This does not alter the authors' adherence to all the PLOS ONE policies on sharing data and materials, as detailed online in the guide for authors.

Figures

Figure 1
Figure 1. Acute and delayed effects of MK801, GK11 and Memantine treatment at the behavioural and histological levels.
(A) Analysis of locomotive behaviour 10 min after the drug administration showed that 5 mg/kg GK11-treated rats exhibited the hyperlocomotive behaviour typically observed shortly after treatment with low dose of a high-affinity NMDAR antagonist. The same tendency was observed after 1 mg/kg MK801treatment. To the contrary, the higher doses of MK801 and Memantine (5 and 50 mg/kg, respectively) induce ataxic effects with reduced maximal speed. (B) Representative traces of individual rats’ routes within the arena during the observation time revealed distinct acute exploratory behaviours after the different treatments. (C, D) 24h after the treatment, GK11-treated rats behaved like control animals, whereas all other treated animals displayed ataxia and reduced exploratory behaviour. Quantitations were performed on 12 rats per group. Statistical analyses were performed using the one-way non-parametric ANOVA statistical test followed by Dunn’s post-tests. *: p<0.05; **: p<0.01; ***:p<0.001 compared to controls. (E) Immunohistological examination of the number of HSP70-positive neurons in the cingulate cortex. Representative images of HSP70 immunostaining: GK11 treatment did not induce any expression of HSP70, whereas a strong signal was observed in pyramidal neurons in MK801- and Memantine-treated rats (scale bar = 250 µm). Inset in MK801 1mg/kg image (scale bar 25 µm). Quantifications were performed in 6 rats per condition. Statistical analyses were performed using the one-way ANOVA statistical test followed by Fisher’s LSD post-tests. *: p<0.05; **: p<0.01; ***:p<0.001 compared to controls. $: p<0.05; $ $: p<0.01; $ $ $: p<0.001 compared to GK11-treated rats.
Figure 2
Figure 2. Microarray results and validation by qPCR.
Comparison of the effects of MK801 and GK11 on gene expression in the cingulate cortex using microarray and qPCR analysis. (A) Cluster analysis of samples/arrays using average linkage between the expression levels of 3,631 probes (see methods) in the 12 Affymetrix microarrays hybridized with: Vehicle-, MK801- and GK11-treated rat cingulate cortex samples (n=4 rats/group. The farther to the right two junctions between samples are, the more dissimilar their transcription profiles. Therefore, MK801’s effect on transcription in the cingulate cortex distinctly differed from the effect of GK11, while transcription in control rats was even more dissimilar than those two treatments. (B) Venn diagram of genes deregulated by MK801 or GK11 treatment in the cingulate cortex. Cutoff thresholds for up- or downregulation ratios were ≥ 1.5 or ≤ 0.66, respectively. The lists of deregulated genes and the corresponding expression ratios are presented in Table S1. (C) Relative ratio of mRNA expression levels obtained with DNA microarrays (grey bars) and qPCR (white bars) for each candidate gene in MK801-treated rats compared to control rats. : genes induced by the treatment (i.e. absent in the control group but present in the treated group); : genes repressed by the treatment (i.e. present in the control group, but absent in the treated group; A: genes absent in all conditions. Horizontal lines represent no change (– ⋅ – ⋅ –) and cut-off fold changes of 1.5 and 0.66 (⋅⋅⋅⋅⋅⋅⋅⋅). (D) Relative ratio of mRNA expression levels obtained with DNA microarrays (grey bars) and qPCR (white bars) for each candidate gene in GK11-treated rats compared with control rats. (E) This graph summarizes the results from the qPCR validation, relative fold change of mRNA expression for each gene from 5 mg/kg MK801 (dark grey bars), 5 mg/kg GK11(white bars) and 50 mg/kg Memantine-treated rats compared to controls. Statistical analysis. Microarray results are presented as fold-change. # indicates significant deregulation (SAM analysis, see materials and methods). qPCR results are presented as mean ± SEM. Statistical analyses were performed using non-parametric one-way ANOVA followed by Dunn’s post-tests. *: p<0.05; ** p<0.01; ***: p<0.001 compared to controls; $: p<0.05; $ $; p<0.01; $ $ $: p<0.001 compared to GK11-treated rats.
Figure 3
Figure 3. Using IPA software and analysis of the literature, the genes deregulated by either MK801 or GK11 treatment were each allocated one main biological function.
Each bar represents the number of genes (expressed as the percentage of the total number of deregulated genes after each treatment) assigned to each specific biological function. Although the functions of a significant number of genes affected by the NMDAR antagonists are unknown, the most affected biofunction corresponds to the inflammatory and immune response regulators.
Figure 4
Figure 4. Effects of MK801, GK11 and Memantine treatment on glial and microglial activation in the rat cortex.
(A) Quantitative analysis of the IBA1-labeled surface in the cingulate cortex 24h after the different drug treatments shows significant microglial activation after high and low doses of MK801 and Memantine treatment, but not after high-dose GK11 administration. The results are presented as the mean ± SEM (n=6 per group). (B) Quantitative analysis of the GFAP-labeled surface (left) and the Optical Density (right) within the labeled surface in the cingulate cortex (96h after the different drug treatments) shows significant astroglial activation after high and low doses of MK801 and Memantine treatment, but only a slight astrogliosis after high-dose GK11 administration. The results are presented as the mean ± SEM (n=3-6 per group). Statistical analyses were performed using one-way ANOVA followed by Fisher’s LSD post-tests. *: p<0.05; **: p<0.01; ***: p<0.001 compared to controls. $: p<0.05; $ $: p<0.1; $ $ $: p<0.001 compared to GK11-treated rats; #: p<0.05; ##: p<0.01; ###:p<0.001 compared to MK801-treated rats.
Figure 5
Figure 5. MK801-elicited microglial activation is caused by neuronal injury.
(A) Comparison of the intrinsic neurotoxicity of GK11 or MK801 on densely seeded and mature cortical cultures. Neuronal cultures were challenged for 48h with increasing concentrations of the NMDAR antagonists. Neuronal suffering was assessed by determining the MAP2-immunopositive surface. Photographs represent typical examples of MAP2-stained neuronal cultures (Scale bar = 20 µm). Bar graph represents quantitative analysis (mean ± SEM from at least three independent experiments). Y axis: % of MAP2-positive surface in neuronal cultures treated with MK801 or GK11 normalized to the sham-treated neuronal cultures. Statistical analyses were performed using two-way ANOVA followed by Fisher’s LSD post-tests. *: p<0.05; **: p<0.01; ***: p<0.001 when compared to controls. $: p<0.05; $ $: p<0.01: $ $ $: p<0.001 when compared to GK11 treated cultures. (B) Effects of conditioned media obtained from Sham, MK801 and GK11-treated neuronal cultures on microglial BV-2 cells morphology. Cells treated with non-conditioned medium show a branched morphology with long processes, and only a few amoeboid cells can be seen. Cells treated with conditioned media from control (0.9% NaCl) or 100 µM GK11-treated neuronal cultures displayed similar morphology. In contrast, BV-2 cells treated with conditioned media from 100 µM MK801-treated neuronal culture show only a few short processes, and the majority of the cells had an amoeboid (“activated”) shape (Scale bar = 100 µm). The number of cells with at least one process (see Materials and Methods for further details) was quantified; the results are presented in the bar graph. The results are the mean ± SEM of quantitations performed in 3 experiments. Statistical analyses were performed using one-way ANOVA followed by Fisher’s LSD post-tests. ***:p<0.001 compared to controls; $ $ $:p<0.001 compared to GK11-treated cultures.

Similar articles

Cited by

References

    1. Kalia LV, Kalia SK, Salter MW (2008) NMDA receptors in clinical neurology: excitatory times ahead. Lancet Neurol 7: 742-755. doi:10.1016/S1474-4422(08)70165-0. PubMed: 18635022. - DOI - PMC - PubMed
    1. Mody I, MacDonald JF (1995) NMDA receptor-dependent excitotoxicity: the role of intracellular Ca2+ release. Trends Pharmacol Sci 16: 356-359. doi:10.1016/S0165-6147(00)89070-7. PubMed: 7491714. - DOI - PubMed
    1. Arundine M, Tymianski M (2003) Molecular mechanisms of calcium-dependent neurodegeneration in excitotoxicity. Cell Calcium 34: 325-337. doi:10.1016/S0143-4160(03)00141-6. PubMed: 12909079. - DOI - PubMed
    1. Low SJ, Roland CL (2004) Review of NMDA antagonist-induced neurotoxicity and implications for clinical development. Int J Clin Pharmacol Ther 42: 1-14. doi:10.5414/CPP42001. PubMed: 14756381. - DOI - PubMed
    1. Planells-Cases R, Lerma J, Ferrer-Montiel A (2006) Pharmacological intervention at ionotropic glutamate receptor complexes. Curr Pharm Des 12: 3583-3596. doi:10.2174/138161206778522092. PubMed: 17073661. - DOI - PubMed

Publication types

MeSH terms