. 2013 Nov 19;8(11):e81162.
doi: 10.1371/journal.pone.0081162. eCollection 2013.

Cisplatin induces a mitochondrial-ROS response that contributes to cytotoxicity depending on mitochondrial redox status and bioenergetic functions

Affiliations

Cisplatin induces a mitochondrial-ROS response that contributes to cytotoxicity depending on mitochondrial redox status and bioenergetic functions

Rossella Marullo et al. PLoS One. .

Abstract

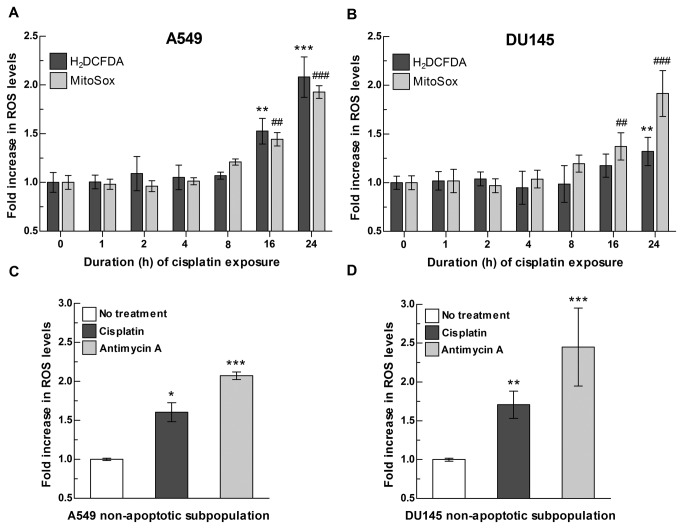
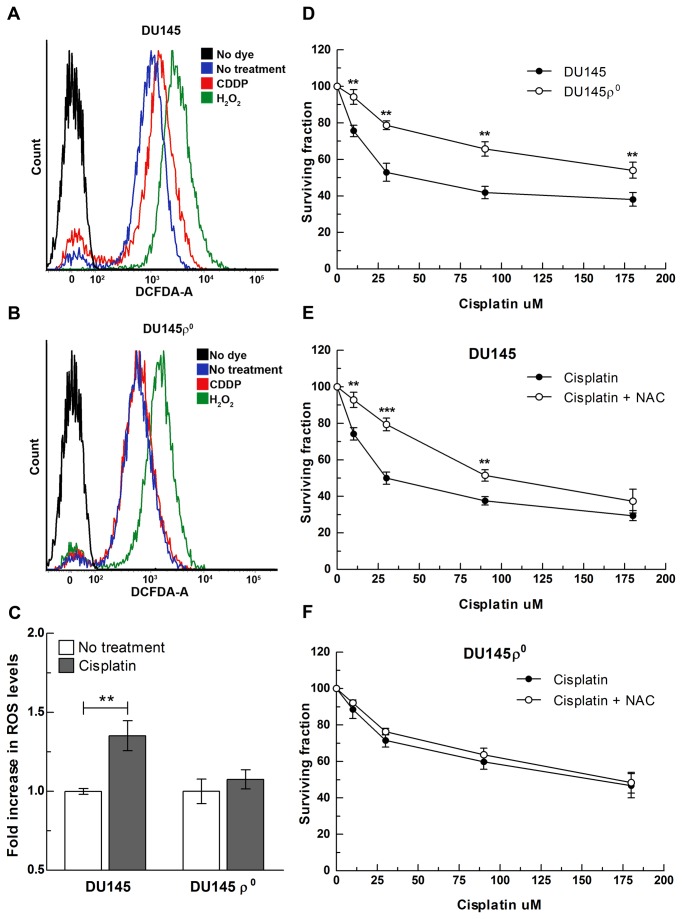
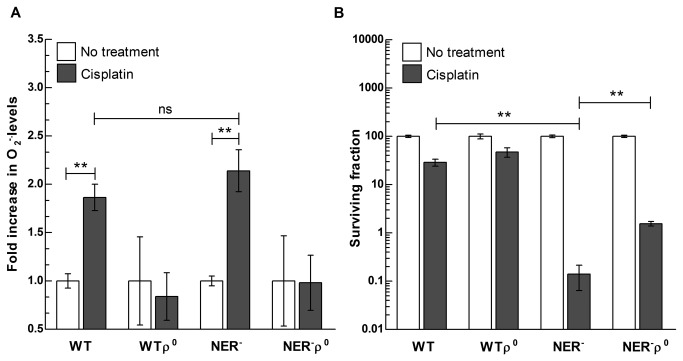
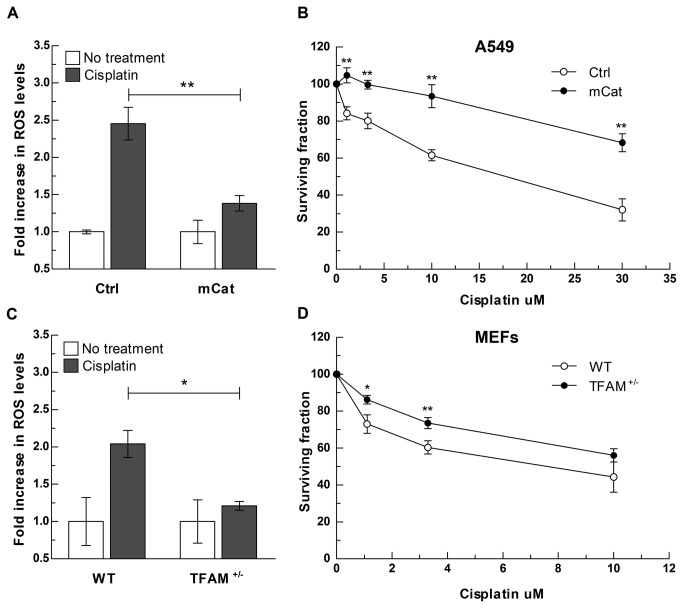
Cisplatin is one of the most effective and widely used anticancer agents for the treatment of several types of tumors. The cytotoxic effect of cisplatin is thought to be mediated primarily by the generation of nuclear DNA adducts, which, if not repaired, cause cell death as a consequence of DNA replication and transcription blockage. However, the ability of cisplatin to induce nuclear DNA (nDNA) damage per se is not sufficient to explain its high degree of effectiveness nor the toxic effects exerted on normal, post-mitotic tissues. Oxidative damage has been observed in vivo following exposure to cisplatin in several tissues, suggesting a role for oxidative stress in the pathogenesis of cisplatin-induced dose-limiting toxicities. However, the mechanism of cisplatin-induced generation of ROS and their contribution to cisplatin cytotoxicity in normal and cancer cells is still poorly understood. By employing a panel of normal and cancer cell lines and the budding yeast Saccharomyces cerevisiae as model system, we show that exposure to cisplatin induces a mitochondrial-dependent ROS response that significantly enhances the cytotoxic effect caused by nDNA damage. ROS generation is independent of the amount of cisplatin-induced nDNA damage and occurs in mitochondria as a consequence of protein synthesis impairment. The contribution of cisplatin-induced mitochondrial dysfunction in determining its cytotoxic effect varies among cells and depends on mitochondrial redox status, mitochondrial DNA integrity and bioenergetic function. Thus, by manipulating these cellular parameters, we were able to enhance cisplatin cytotoxicity in cancer cells. This study provides a new mechanistic insight into cisplatin-induced cell killing and may lead to the design of novel therapeutic strategies to improve anticancer drug efficacy.


Conflict of interest statement

Competing Interests: The authors have declared that no competing interests exist.

Figures

Figure 1
Figure 1. Cisplatin exposure induces an increase in total intracellular and mitochondrial ROS in non-apoptotic cancer cells.
(A-B) Temporal analysis of ROS levels following cisplatin exposure in (A) A549 and (B) DU145 cells. A549 and DU145 cells were exposed to cisplatin at an IC50 dose (12 μM and 20 μM, respectively) and ROS levels were measured at the indicated time points by incubating with H2DCFDA or MitoSox fluorescent probes. ROS levels in treated vs. non treated cells at each time point were analyzed independently for each probe by two-way ANOVA. For total intracellular ROS levels (H2DCFDA): treatment x time point interaction p<0.05 for DU145 cells and p<0.001 for A549 cells; Bonferroni post-test for multiple comparison: ** p<0.01, *** p<0.001. For mitochondrial ROS (MitoSox): treatment x time interaction p<0.001 for DU145 and A549 cells; Bonferroni post-test for multiple comparison: ## p<0.01, ### p<0.001. (C-D) ROS levels following cisplatin exposure in non-apoptotic (C) A549 and (D) DU145 cells. A549 and DU145 cells were exposed to cisplatin at an IC50 dose and ROS levels measured in Annexin V-negative subpopulation as described in Materials and Methods and in Figure S2. Antimycin A was used as positive control for mitochondrial ROS generation. ROS levels in treated vs. non treated cells were analyzed by one-way ANOVA (p<0.001 A549 and DU145 cells; Bonferroni post-test for multiple comparison: *p<0.05, **p<0.01, *** p<0.0001). Data are presented as fold increase over no treatment. Bars represent the mean of n=3-6 independent biological replicates +/- SD.
Figure 2
Figure 2. (A-C) Mitochondria are the source of cisplatin-induced ROS in cancer cells.
Representative flow cytometry curves of total intracellular ROS levels (H2DCFDA) in (A) DU145 and (B) isogenic DU145ρ° cells following 24 h of exposure to cisplatin at an IC50 dose (20 μM). H2O2 was used as positive control. (C) Quantitative representation of previous experiment. Data are presented as fold increase over no treatment. Bars represent the mean of n=3 independent biological replicates +/- SD. ROS levels in treated vs. non treated cells in DU145 and DU145ρ° genotypes were analyzed by two-way ANOVA (treatment x genotype interaction p<0.05; Bonferroni post-test for multiple comparison: ** p<0.01). (D-F) Mitochondrial ROS contribute to the cell killing effect of cisplatin. (D) Survival of DU145 and isogenic DU145ρ° after exposure to a dose range of cisplatin. (E) DU145 and (F) DU145ρ° cell survival after exposure to a dose range of cisplatin with or without 1 mM of NAC. Data represent mean of n=3 independent experiments +/- SD. **p<0.005, ***p<0.0005.
Figure 3
Figure 3. Cisplatin-induced mitochondria-dependent increases in ROS levels occur by a mechanism independent of nDNA damage signaling.
WT and NER- cells and their isogenic WTρ° and NER-ρ0 genotypes were exposed to cisplatin (100 μM) for 2 h and (A) intracellular ROS levels were measured by incubating with dihydroethidium fluorescence probe. Bars represent the mean of n=3-6 independent biological replicates +/- SD. ROS levels in treated vs. non treated cells in WT, WTρ°, NER- and NER-ρ0 strains were analyzed by two-way ANOVA (treatment x genotype interaction p<0.05; Bonferroni post-test for multiple comparison:** p<0.01). (B) Viability of WT and NER- cells and their isogenic WTρ° and NER-ρ0 strains after exposure to cisplatin (100 μM). Bars represent the mean of n=3-6 independent biological replicates +/- SD. Data were analyzed with Student t-test with Bonferroni correction for multiple comparisons; ns: not significant, **p<0.001.
Figure 4
Figure 4. (A-B) Cisplatin exposure reduces the expression of mitochondrial-DNA encoded proteins.
(A) Representative Western Blot of mitochondrial-encoded cytochrome c oxidase subunit 1 (MT-CO1) and succinate dehydrogenase subunit A (SDHA) expression in A549 cells exposed to cisplatin (CDDP) or carboplatin (CBCDA) at a IC50 dose (12 μM and 50 μM, respectively) for 24 h. Chloramphenicol (CLP) at 100 μg/mL was used as positive control. (B) Quantitative analysis of n=3 independent biological replicates. MT-CO1 expression was normalized over SDHA expression. Data are presented as fold change over control (no treatment). (C-D) Carboplatin is less efficient than cisplatin in impairing mtDNA transcription and generating ROS in cancer cells. (C) MT-CO1 mRNA levels following exposure to cisplatin and carboplatin. A549 cells were exposed to cisplatin and carboplatin at an IC50 dose (12 μM and 50 μM, respectively) and mRNA levels analyzed by qRT-PCR as described in Materials and Methods. Bar represent mean of n=5 experiments +/- SEM. Data are presented as fold change compared to control (no treatment, black dotted line). MT-CO1 mRNA expression levels in treated vs. non treated cells were analyzed by one-way ANOVA (p<0.005; Bonferroni post-test for multiple comparison:* p<0.05; **p<0.005 (D) ROS levels in A549 following exposure to cisplatin and carboplatin. A549 cells were exposed to cisplatin (CDDP) at an IC50 dose (12 µM) or a range of carboplatin (CBCDA) doses and total intracellular ROS levels were measured after 24 h by incubating with H2DCFDA. ROS levels in treated vs. non treated cells were analyzed by one-way ANOVA (p<0.005; Bonferroni post-test for multiple comparison: *p<0.05, **p<0.01). Data are presented as fold increase over control (no treatment). Bars represent the mean of n=3 independent biological replicates +/- SD.
Figure 5
Figure 5. (A-B) Cells with increased expression of catalase in mitochondria are less sensitive to cisplatin.
(A) mCat and isogenic Ctrl cells were exposed to cisplatin (12 μM) for 24 h and ROS levels measured by incubating with H2DCFDA. Data are presented as fold increase over no treatment. Bars represent the mean of n=3 independent biological replicates +/- SD. ROS levels in treated vs. non treated cells in Ctrl and mCat genotypes were analyzed by two-way ANOVA (treatment x genotype interaction p<0.001; Bonferroni post-test for multiple comparison: ** p<0.001). (B) Survival of mCat cells and Ctrl cells following 72 h of exposure to a dose range of cisplatin. Data represent mean of n=3 independent experiments +/- SD; ** p<0.005. (C-D) Cells with dysfunctional mitochondria are less sensitive to cisplatin. (C) WT and TFAM+/- MEFs were exposed to cisplatin (10 μM) for 24 h and ROS levels measured by Amplex Red as described in Materials and Methods S1. Data are presented as fold increase over no treatment. Bars represent the mean of n=3 independent biological replicates +/- SD. ROS levels in treated vs. non treated cells in WT and TFAM+/- genotypes were analyzed by two-way ANOVA (treatment x genotype interaction p<0.05; Bonferroni post-test for multiple comparison: * p<0.05). ROS levels in exposed to cisplatin at an IC50 dose (10 μM) for 24 h. ROS levels were measured (D) Survival of WT and TFAM+/- MEFs exposed to a dose range of cisplatin. *p<0.05, p<0.005.
Figure 6
Figure 6. Metabolic state of the cell determines the contribution of the mitochondrial-ROS component to the cytotoxic effect of cisplatin.
Survival of A549 cells after 72 h exposure to a dose range of either (E) cisplatin or (F) carboplatin with or without exposure to 1 mM of DCA. Data represent mean of n=3 independent experiments +/- SD; **p<0.005.
Figure 7
Figure 7. Model for major components of cisplatin-induced cytotoxicity.
Cellular exposure to cisplatin causes direct damage to mtDNA resulting in a reduction of mitochondrial protein synthesis, impairment of electron transport chain function, and subsequently, increases in intracellular ROS levels. ROS ultimately promotes cell death, resulting in a significant enhancement of the cytotoxic effect exerted by cisplatin through the generation of nDNA damage. Mitochondrial dysfunction, increased ability to scavenge mitochondrial ROS and glycolytic metabolism reduce cellular sensitivity to the mitochondrial-ROS mediated component of cisplatin cytotoxicity. Reduction in cellular sensitivity to cisplatin can also be achieved by increased DNA repair capacity. Additional, minor components not illustrated in this model may also affect cisplatin cytotoxicity.

References

    1. Pascoe JM, Roberts JJ (1974) Interactions between mammalian cell DNA and inorganic platinum compounds-I: DNA interstrand cross-linking and cytotoxic properties of platinum(II) compounds. Biochem Pharmacol 23: 1345-1357. doi:10.1016/0006-2952(74)90354-2. PubMed: 4831343. - DOI - PubMed
    1. Fichtinger-Schepman AMJ, Van der Veer JL, Den Hartog JHJ, Lohman PHM, Reedijk J (1985) Adducts of the antitumor drug cis-diamminedichloroplatinum(II) with DNA: formation, identification, and quantitation. Biochemistry 24: 707-713. doi:10.1021/bi00324a025. PubMed: 4039603. - DOI - PubMed
    1. Damia G, Imperatori L, Stefanini M, D'Incalci M (1996) Sensitivity of CHO mutant cell lines with specific defects in nucleotide excision repair to different anti-cancer agents. Int J Cancer 66: 779-783. doi:10.1002/(SICI)1097-0215(19960611)66:6. PubMed: 8647649. - DOI - PubMed
    1. Beljanski V, Marzilli LG, Doetsch PW (2004) DNA Damage-Processing Pathways Involved in the Eukaryotic Cellular Response to Anticancer DNA Cross-Linking Drugs. Mol Pharmacol 65: 1496-1506. doi:10.1124/mol.65.6.1496. PubMed: 15155842. - DOI - PubMed
    1. Lee KB, Parker RJ, Bohr V, Cornelison T, Reed E (1993) Cisplatin sensitivity/resistance in UV repair-deficient Chinese hamster ovary cells of complementation groups 1 and 3. Carcinogenesis 14: 2177-2180. doi:10.1093/carcin/14.10.2177. PubMed: 8222071. - DOI - PubMed

Publication types

MeSH terms