

State of the human proteome in 2013 as viewed through PeptideAtlas: comparing the kidney, urine, and plasma proteomes for the biology- and disease-driven Human Proteome Project
- PMID: 24261998
- PMCID: PMC3951210
- DOI: 10.1021/pr4010037
State of the human proteome in 2013 as viewed through PeptideAtlas: comparing the kidney, urine, and plasma proteomes for the biology- and disease-driven Human Proteome Project
Abstract
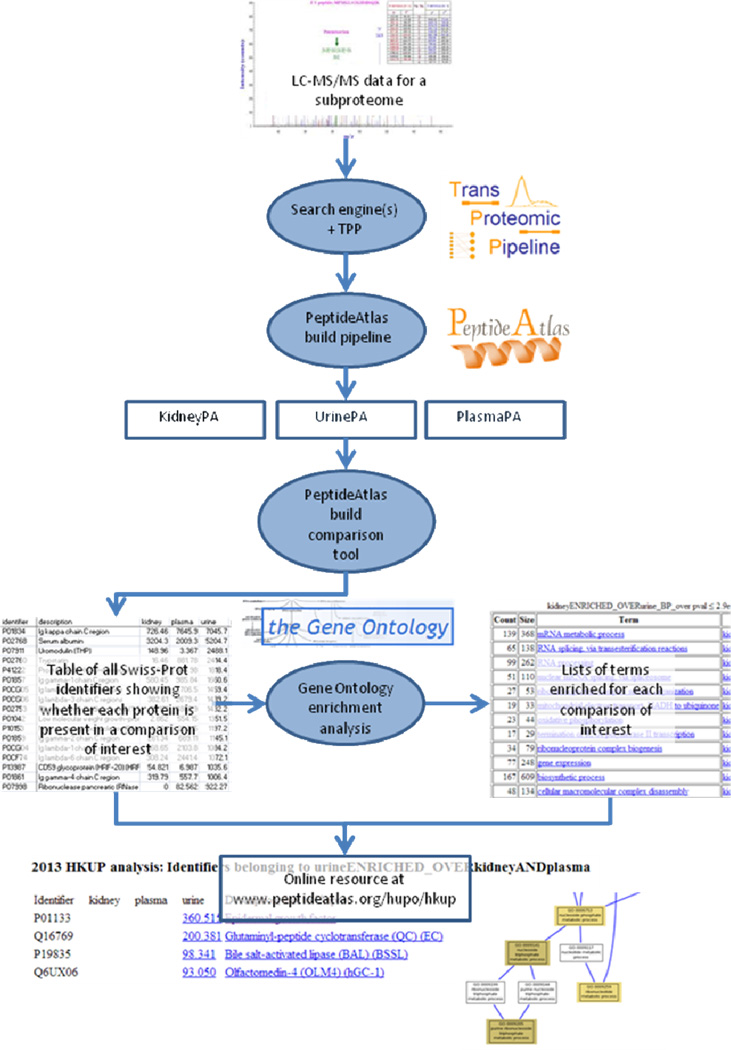
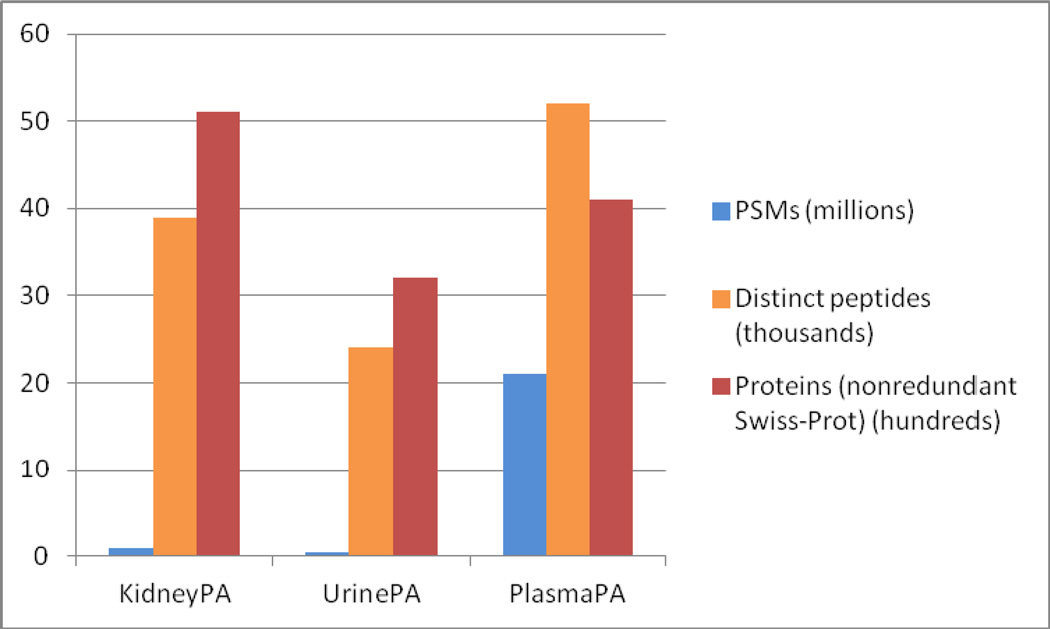
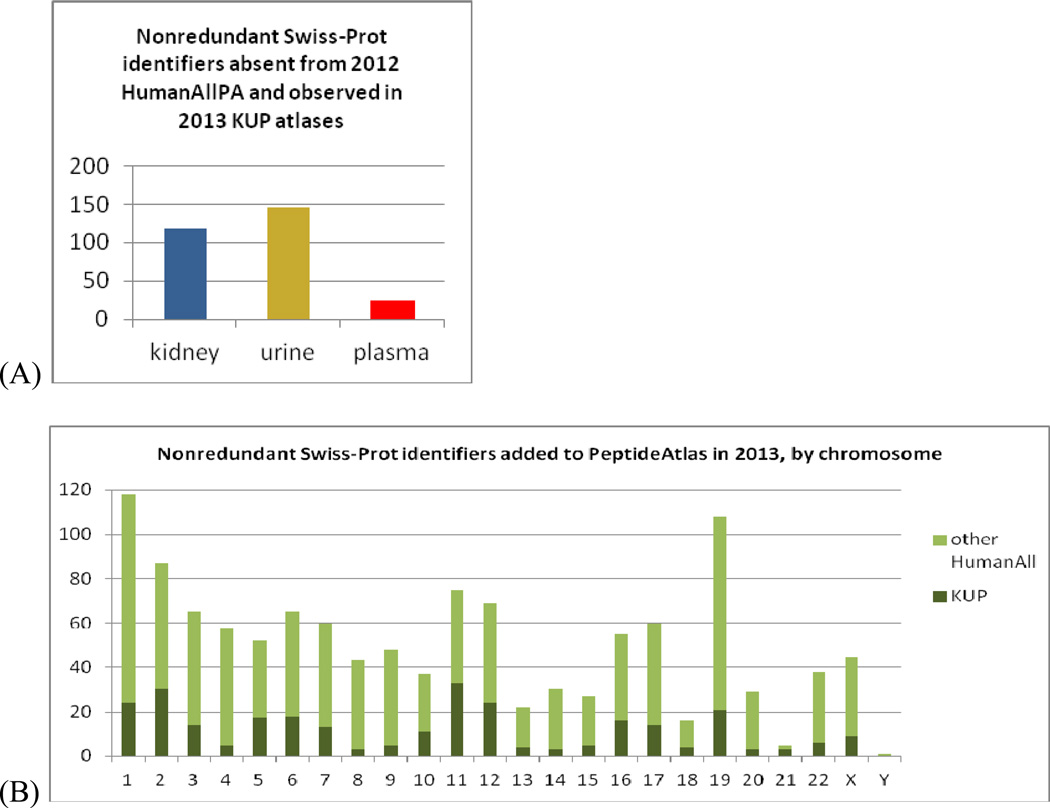
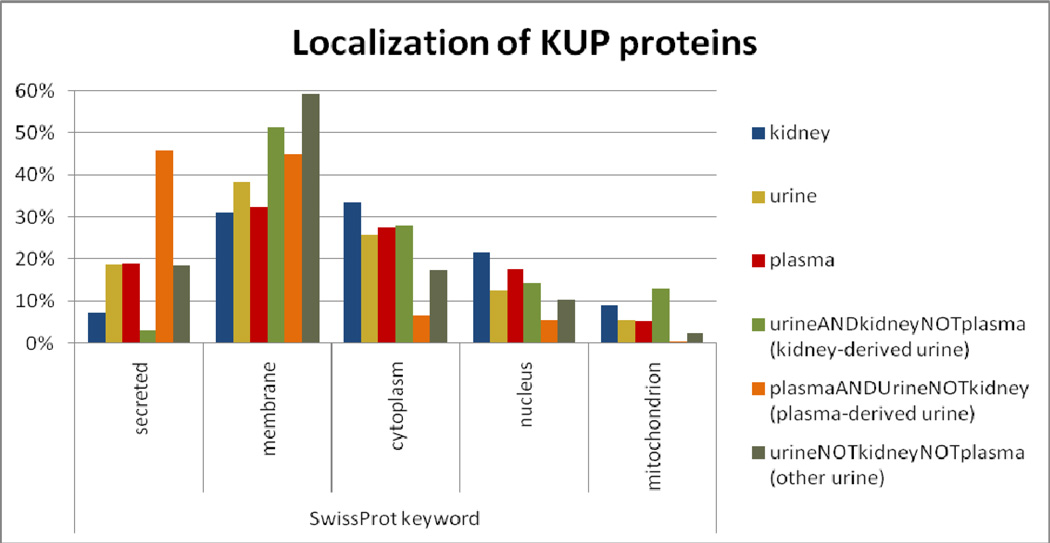
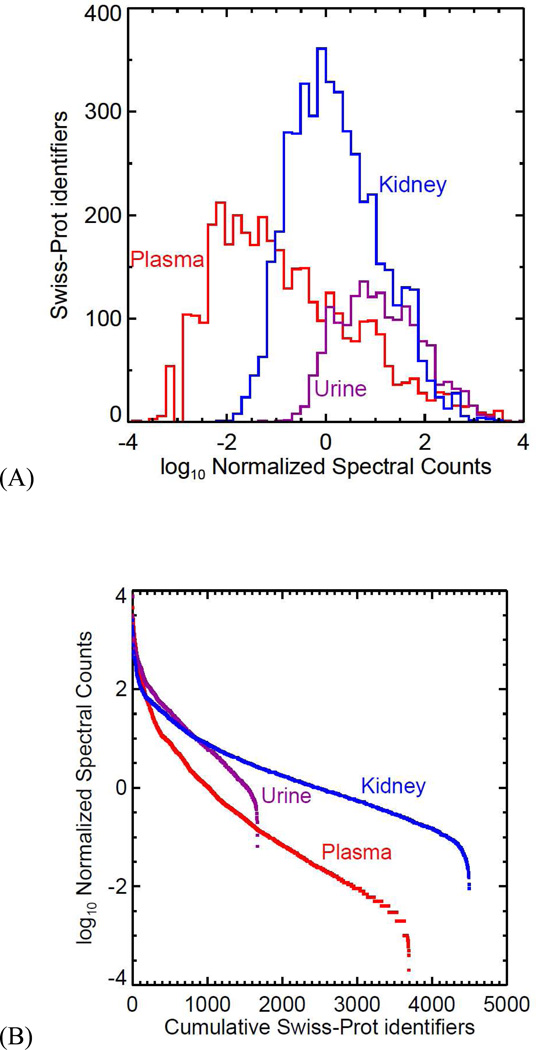
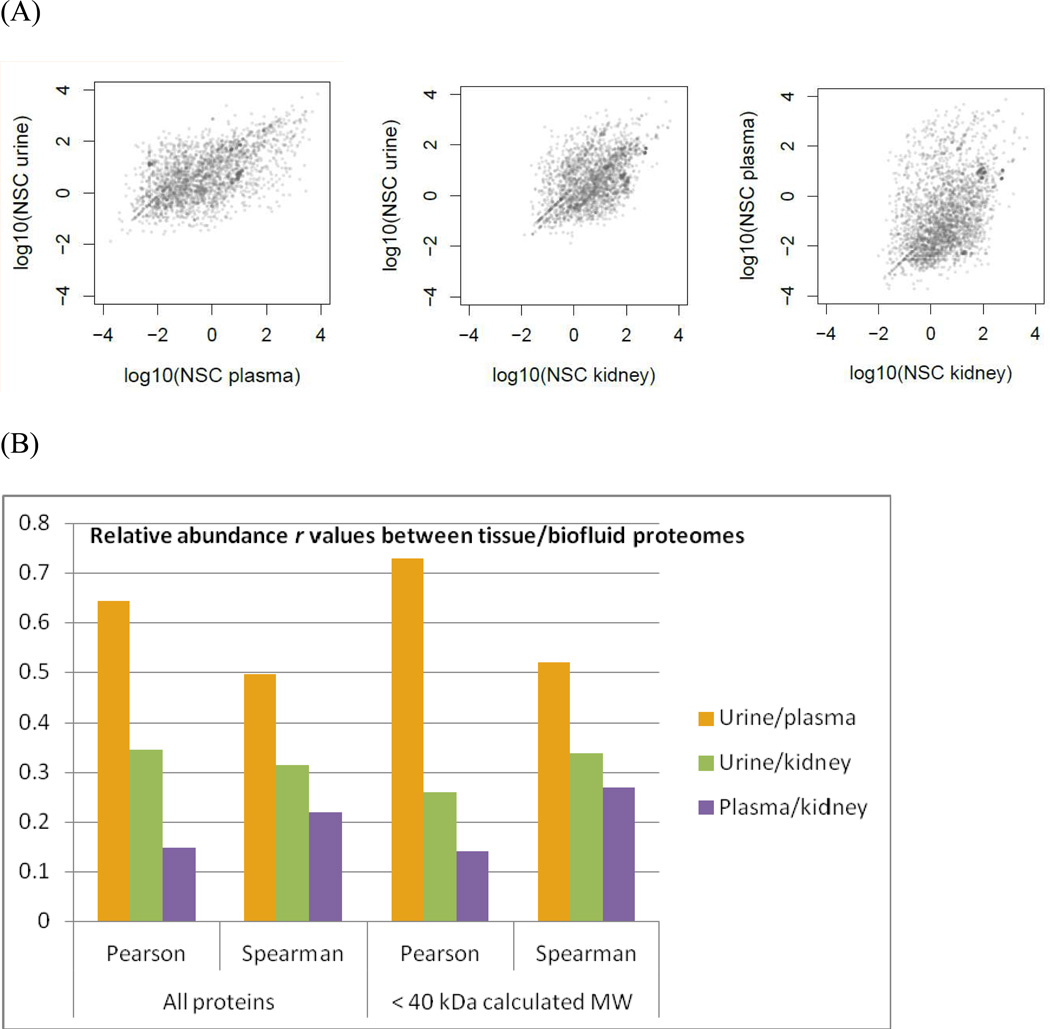
The kidney, urine, and plasma proteomes are intimately related: proteins and metabolic waste products are filtered from the plasma by the kidney and excreted via the urine, while kidney proteins may be secreted into the circulation or released into the urine. Shotgun proteomics data sets derived from human kidney, urine, and plasma samples were collated and processed using a uniform software pipeline, and relative protein abundances were estimated by spectral counting. The resulting PeptideAtlas builds yielded 4005, 2491, and 3553 nonredundant proteins at 1% FDR for the kidney, urine, and plasma proteomes, respectively - for kidney and plasma, the largest high-confidence protein sets to date. The same pipeline applied to all available human data yielded a 2013 Human PeptideAtlas build containing 12,644 nonredundant proteins and at least one peptide for each of ∼14,000 Swiss-Prot entries, an increase over 2012 of ∼7.5% of the predicted human proteome. We demonstrate that abundances are correlated between plasma and urine, examine the most abundant urine proteins not derived from either plasma or kidney, and consider the biomarker potential of proteins associated with renal decline. This analysis forms part of the Biology and Disease-driven Human Proteome Project (B/D-HPP) and is a contribution to the Chromosome-centric Human Proteome Project (C-HPP) special issue.
Figures
References
-
- Aebersold R, Mann M. Mass spectrometry-based proteomics. Nature. 2003;422(6928):198–207. - PubMed
-
- Legrain P, Aebersold R, Archakov A, Bairoch A, Bala K, Beretta L, Bergeron J, Borchers CH, Corthals GL, Costello CE, Deutsch EW, Domon B, Hancock W, He F, Hochstrasser D, Marko-Varga G, Salekdeh GH, Sechi S, Snyder M, Srivastava S, Uhlen M, Wu CH, Yamamoto T, Paik YK, Omenn GS. The human proteome project: current state and future direction. Mol Cell Proteomics. 2011;10(7) M111 009993. - PMC - PubMed
-
- Marko-Varga G, Omenn GS, Paik YK, Hancock WS. A first step toward completion of a genome-wide characterization of the human proteome. J Proteome Res. 2013;12(1):1–5. - PubMed
Publication types
MeSH terms
Substances
Grants and funding
- RC2 HG005805/HG/NHGRI NIH HHS/United States
- R01 GM087221/GM/NIGMS NIH HHS/United States
- U54DA021519/DA/NIDA NIH HHS/United States
- 2P50 GM076547/GM/NIGMS NIH HHS/United States
- P50 GM076547/GM/NIGMS NIH HHS/United States
- P30 ES017885/ES/NIEHS NIH HHS/United States
- P30 DK020572/DK/NIDDK NIH HHS/United States
- U54 DA021519/DA/NIDA NIH HHS/United States
- UL1RR24986/RR/NCRR NIH HHS/United States
- RM-08-029/RM/RMOD NIH HHS/United States
- UL1 RR024986/RR/NCRR NIH HHS/United States
- P30U54ES017885/ES/NIEHS NIH HHS/United States
LinkOut - more resources
Full Text Sources
Other Literature Sources
