. 2014 Feb;25(2):260-75.
doi: 10.1681/ASN.2012121217. Epub 2013 Nov 21.

Evidence for activation of the unfolded protein response in collagen IV nephropathies

Affiliations

Evidence for activation of the unfolded protein response in collagen IV nephropathies

Myrtani Pieri et al. J Am Soc Nephrol. 2014 Feb.

Abstract

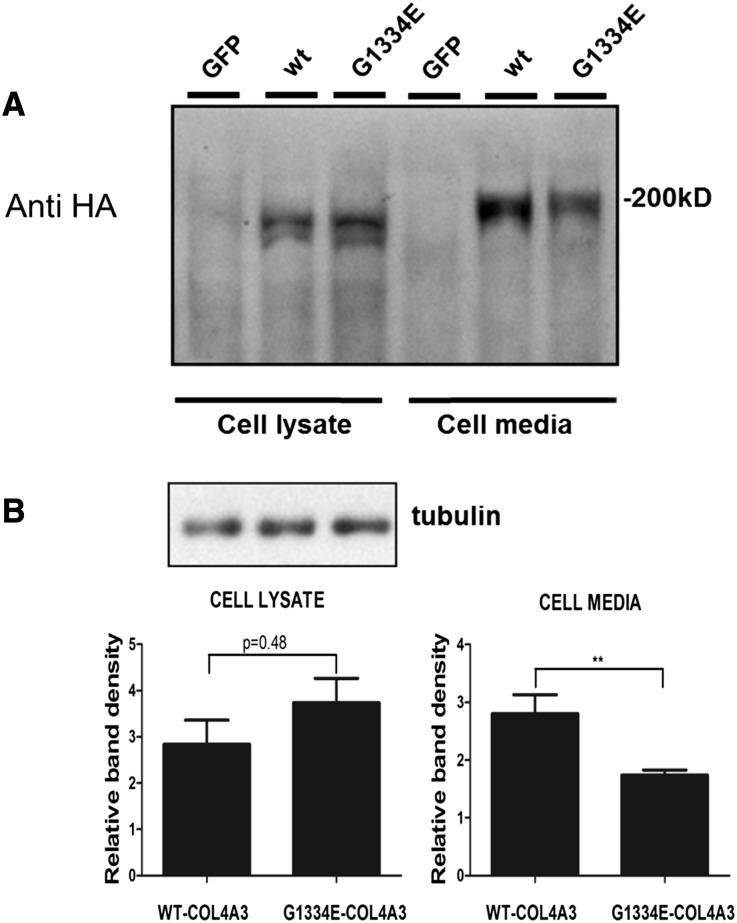
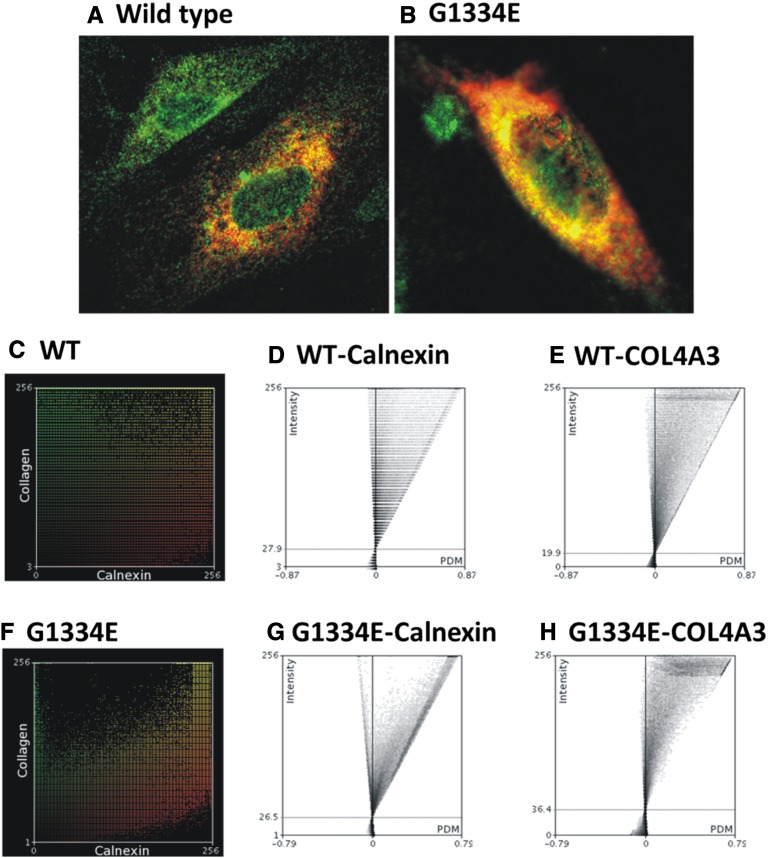
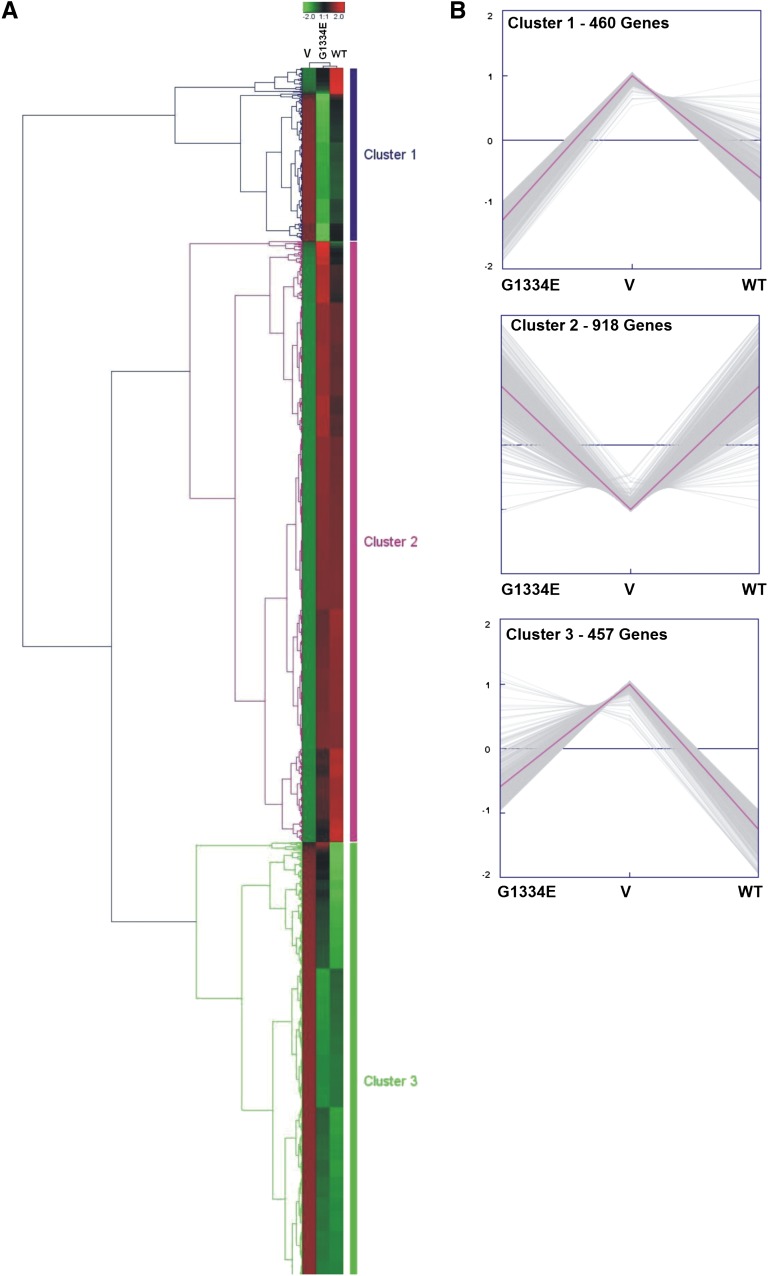
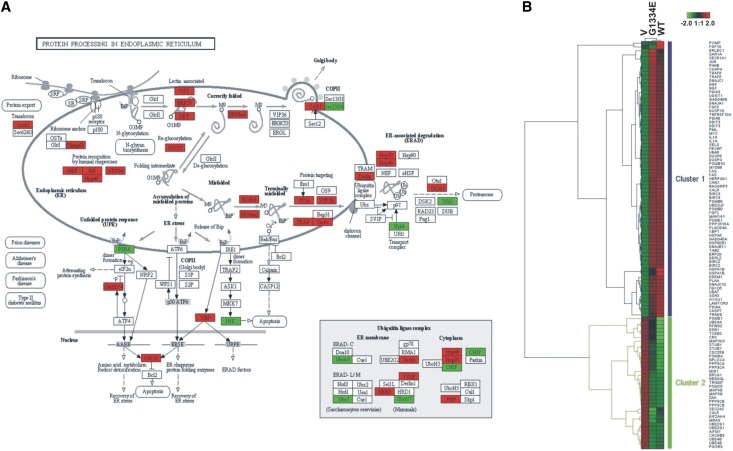
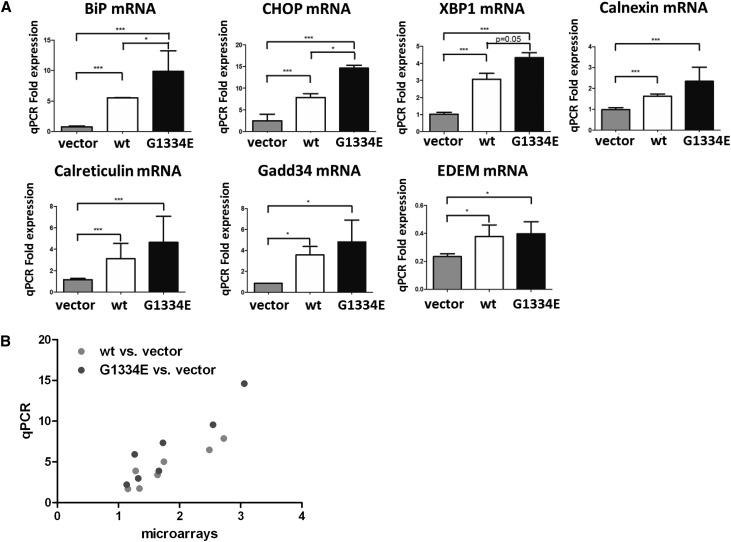
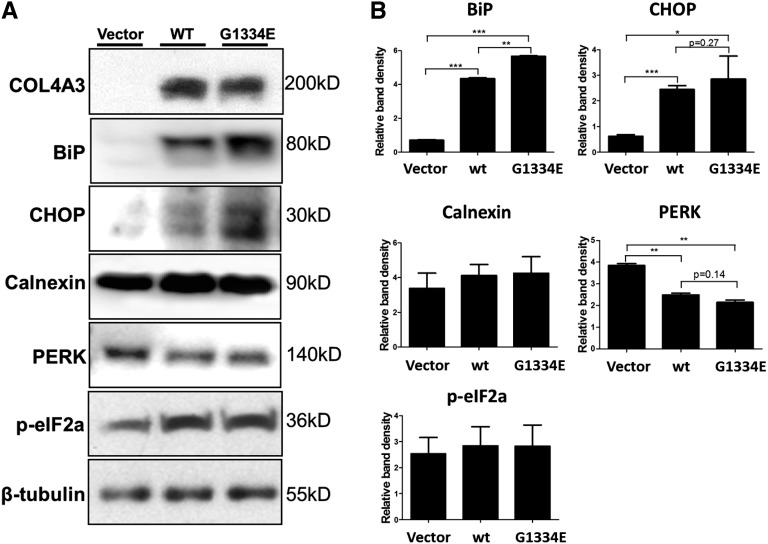
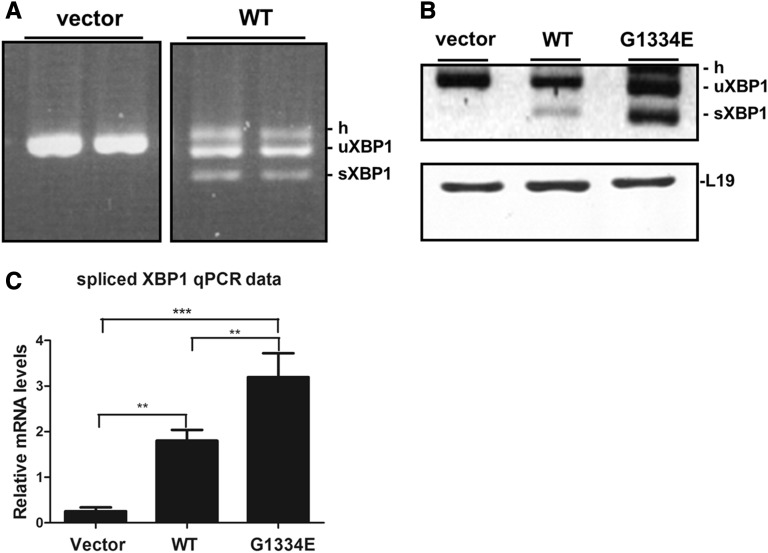
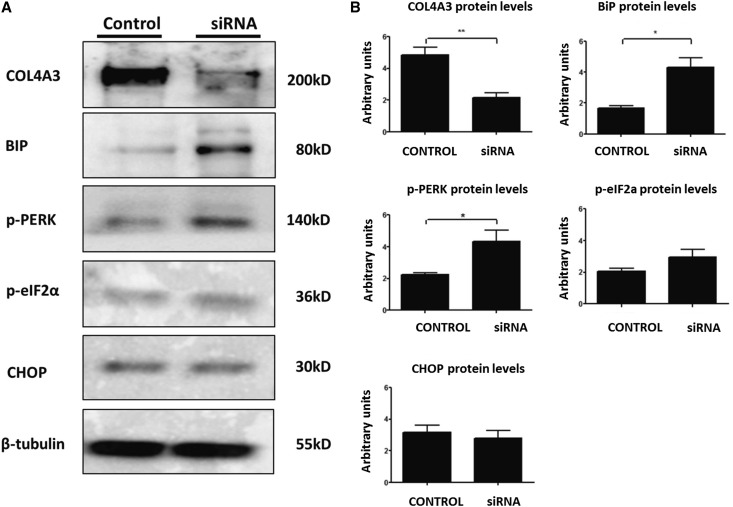
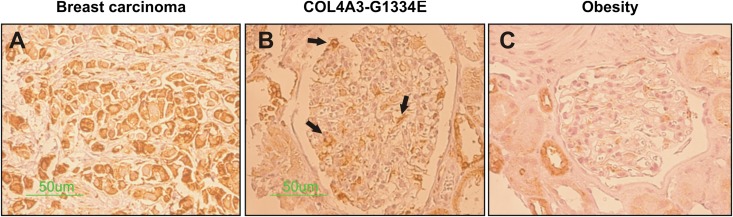
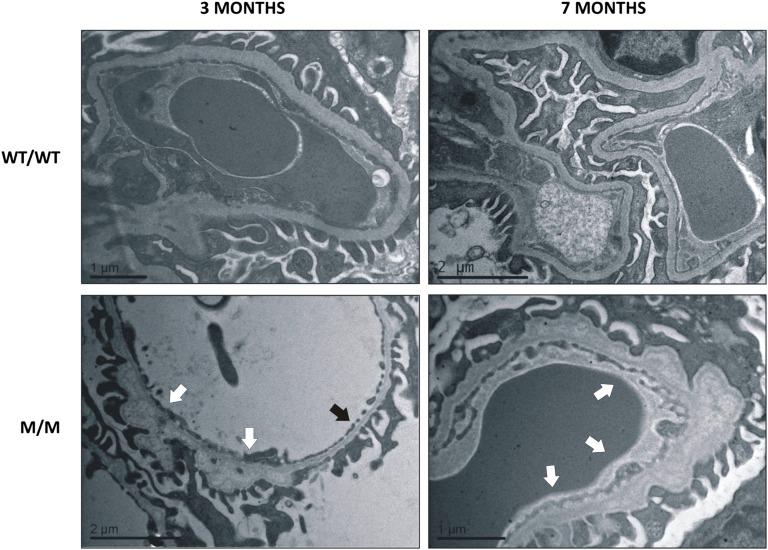
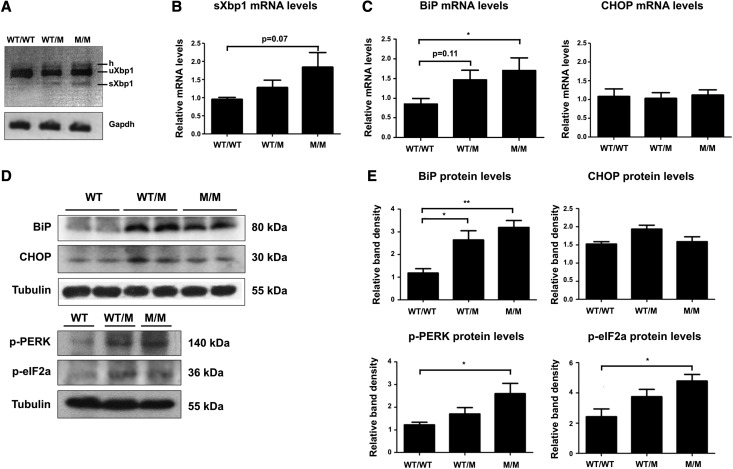
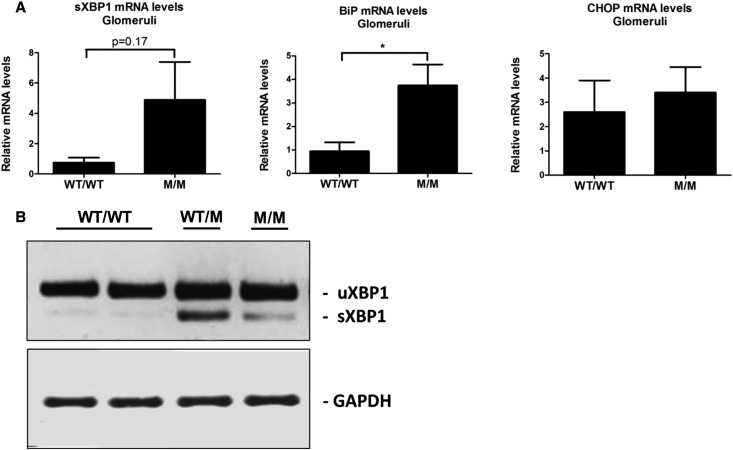
Thin-basement-membrane nephropathy (TBMN) and Alport syndrome (AS) are progressive collagen IV nephropathies caused by mutations in COL4A3/A4/A5 genes. These nephropathies invariably present with microscopic hematuria and frequently progress to proteinuria and CKD or ESRD during long-term follow-up. Nonetheless, the exact molecular mechanisms by which these mutations exert their deleterious effects on the glomerulus remain elusive. We hypothesized that defective trafficking of the COL4A3 chain causes a strong intracellular effect on the cell responsible for COL4A3 expression, the podocyte. To this end, we overexpressed normal and mutant COL4A3 chains (G1334E mutation) in human undifferentiated podocytes and tested their effects in various intracellular pathways using a microarray approach. COL4A3 overexpression in the podocyte caused chain retention in the endoplasmic reticulum (ER) that was associated with activation of unfolded protein response (UPR)-related markers of ER stress. Notably, the overexpression of normal or mutant COL4A3 chains differentially activated the UPR pathway. Similar results were observed in a novel knockin mouse carrying the Col4a3-G1332E mutation, which produced a phenotype consistent with AS, and in biopsy specimens from patients with TBMN carrying a heterozygous COL4A3-G1334E mutation. These results suggest that ER stress arising from defective localization of collagen IV chains in human podocytes contributes to the pathogenesis of TBMN and AS through activation of the UPR, a finding that may pave the way for novel therapeutic interventions for a variety of collagenopathies.


Figures

Figure 1.
Figure 1.
Mutant COL4A3 chain is secreted less efficiently when expressed in AB8/1 cells. (A) AB8/13 cells were transiently transfected with expression vectors containing WT (COL4A3-WT) collagen chain or mutated COL4A3 (COL4A3-G1334E) cDNAs, which included an HA epitope at C-terminus of the protein. Single chain expression and secretion were measured via Western blot analysis of the cell lysate and the cell medium, respectively, 48 hours after transfection. No HA antigen was detected in AB8/13 cells transfected with a vector expressing the green fluorescent protein (GFP). (B) The extracellular levels of the COL4A3-G1334E chain were significantly lower, reaching 70% of WT COL4A3 levels. A shows a representative Western blot and B shows relative band density that corresponds to HA tag immunoreactivity (i.e., COL4A3) that was normalized to tubulin expression for the cell lysate. Data are represented as means±SEM of n≥3 independent experiments; **P<0.01.
Figure 2.
Figure 2.
Mutant collagen IV chain is more prominently localized in the ER when expressed in AB8/13 cells. Equal expression of the WT (A) or the G1334E mutant protein (B) is retained in the cells’ ER, as shown by colocalization (yellow) of the ER marker calnexin (green) with COL4A3 chain (red). Intensity correlation analysis of the immunocytochemistry images C and F show the color scatter plots of the red (collagen) and green (calnexin) channels. (D, E, G, and H) Intensity correlation analysis plots where for each pixel the product of differences from the mean value is plotted with respect to its intensity. As indicated, the co-localization of collagen and calnexin in the WT is more random as opposed to the improved association seen in the mutant. The intensity correlation analysis was performed using the ImageJ software.
Figure 3.
Figure 3.
Unsupervised hierarchical cluster illustrating differentially expressed genes between vector only (V), WT, and COL4A3-G1334E (G1334E)–expressing cells. (A) Unsupervised hierarchical cluster based on 1835 probe sets with highest variation in three different transfections in podocytes: with empty pcDNA6-HA vector (V) and vectors expressing the WT COL4A3 chain or the mutant COL4A3-G1334E chain (G1334E). Three main gene clusters were noticed. Color saturation is directly proportional to the measured expression ratio magnitude. Euclidian distance was used as the metric. Rows represent individual probe sets. Columns represent the three experimental conditions. Red bars indicate high expression, and green bars indicate low expression. (B) K-means clustering verified the existence of three main gene clusters: cluster 1 (460 genes), cluster 2 (918 genes), and cluster 3 (457 genes).
Figure 4.
Figure 4.
(A) Enrichment analysis showing that the protein processing in the endoplasmic reticulum pathway is greatly deregulated in transfected cells. The KEGG pathway depicts the molecules that take part in the protein processing in the ER. The highlighted molecules were significantly deregulated in the cells transfected with the mutant COL4A3-G1334E or the COL4A3-WT chain versus those transfected with an empty vector. Significantly upregulated genes in the pathway are shown in red, whereas significantly downregulated genes are green (see also Supplemental Table 3). (B) Unsupervised hierarchical cluster based on 118 genes involved directly in the protein processing in the endoplasmic reticulum recognizes two main gene clusters. Color saturation is directly proportional to the measured expression ratio magnitude. Euclidian distance was used as the metric. Rows represent individual probe sets. Columns represent the three experimental conditions: empty vector (V), WT, or G1334E. Red bars indicate high expression, and green bars indicate low expression.
Figure 5.
Figure 5.
The deregulation of selected genes based on microarray data is verified by qPCR. (A) Graph plots of qPCR data in showing fold increase in mRNAs of various UPR genes in cells expressing vector only (gray bars), WT COL4A3 (white bars), or COL4A3-G1334E mutant chain (black bars) compared with cells expressing vector only. All mRNAs of UPR genes were significantly upregulated in cells expressing WT or mutant COL4A3 compared with cells expressing vector only, thus verifying the microarray data. BiP, CHOP, and XBP1 mRNAs are significantly increased in mutant expressing cells compared with controls (Data are means±SEM, n≥3 independent experiments; *P<0.05; **P<0.01. (B) Positive correlation between microarrays and qPCR experimentation. Good agreement is identified between the microarrays and the qPCR results both for the WT versus vector (R2=0.87; 95% confidence interval [95% CI], 0.62 to 0.99; P=0.0020) and for the G1334E versus vector (R2=0.88; 95% CI, 0.62 to 0.99; P=0.0019) experiments. Results are presented as scatterplot. EDEM, ER degradation enhancer, mannosidase α-like.
Figure 6.
Figure 6.
UPR proteins are deregulated in AB8/13 cells transfected with wild type or mutant COL4A3. (A) Undifferentiated cells are transfected with equal amounts of COL4A3-WT (WT), COL4A3-G1334E (G1334E), or the empty pcDNA6/HA vector (Vector; used as a negative control). Protein expression of the UPR markers BiP, CHOP, calnexin, PERK, and p-eIF2a was measured 48 hours after transfection via Western blotting. β-Tubulin expression in the same samples was used as an equal loading control. Shown is a representative blot, with differential levels of the various proteins. (B) Western blotting is quantified via densitometric analysis. Data are means±SEM of three independent experiments. While calnexin and p-eIF2a remain unaltered, BiP and CHOP are upregulated in cells overexpressing the WT or mutant collagen IV chain, and PERK is downregulated. *P<0.05; **P<0.01; ***P<0.001.
Figure 7.
Figure 7.
Single-chain expression of WT or COL4A3-G1334E induces XBP1 splicing in AB8/13 cells. (A) Representative experiment of RT-PCR of the XBP1 mRNA in AB8/13 cells transiently expressing COL4A3-WT collagen chain or the empty pcDNA6/HA vector (vector). PCR products were run on 3% agarose gel. It is apparent that overexpression of WT chain induces XBP1 splicing, as evidenced by the appearance of the smaller spliced form (sXBP1) and the heteroduplex species formed between unspliced and spliced chains (h). The spliced molecules are smaller by 26 bp. (B) Representative experiment of RT-PCR of the XBP1 mRNA in AB8/13 cells transiently expressing COL4A3-WT, mutant COL4A3-G1334E chain, or the empty pcDNA6/HA vector. PCR products were run on 3% agarose gel. It is evident that overexpression of both WT and mutant chains results in XBP1 splicing. L19 was used as an internal PCR control. (C) Real-time PCR for direct quantitation of the spliced XBP1 isoform using primers in the spliced-unspliced interface. Notice the highly statistical difference in the spliced form between vector-only–, WT-, and mutant-expressing cells. Especially important is the differential induction of XBP1 splicing comparing WT with mutant cells. Data are means±SEM of three independent experiments; **P<0.01; ***P<0.001. uXBP1, unspliced XBP1.
Figure 8.
Figure 8.
Knockdown of endogenous COL4A3 in differentiated podocytes activates the UPR pathway. Differentiated cells are treated with COL4A3 siRNA to knock down endogenous COL4A3 expression. (A) Protein expression of the UPR markers BiP, CHOP, p-PERK, and p-eIF2a was measured 72 hours after transfection via Western blotting. β-Tubulin expression in the same samples was used as equal loading control. Scrambled siRNA was used as a negative control in all experiments. Shown is a representative blot, with differential levels of the various proteins. Note the effective downregulation of the target gene and the upregulation of UPR markers. (B) Western blotting in A was quantified via densitometric analysis. Data are means±SEM of three independent experiments. While CHOP remained unaltered, BiP and p-PERK were upregulated in cells being treated with COL4A3 siRNA. *P<0.05; **P<0.01.
Figure 9.
Figure 9.
BiP protein expression is increased in renal biopsies of COL4A3-G1334E heterozygous carriers. Detection of BiP expression in the glomerulus from renal biopsy specimens of two patients diagnosed with TBMN and confirmed heterozygous carriers of the COL4A3-G1334E mutation, using immunohistochemical staining (B). Kidney biopsy specimens from a patient with breast carcinoma (A) and six obese persons (C) were used as positive and negative controls, respectively. In the patients with confirmed COL4A3-G1334E mutation, serial sections show strong perinuclear BiP immunoreactivity in the glomerulus compared with the obese controls. Tubular cells of both the patient with COL4A3-G1334E and the obese persons are stained positive for BiP. All samples are sex and age matched.
Figure 10.
Figure 10.
Ultrastractural pathology of the mutant knockin mice is consistent with Alport Syndrome nephritis. WT mice (WT/WT) display normal GBM thickness, 280–300 nm range, while G1332E/G1332E (M/M) homozygous mice demonstrate thin GBMs, 140–160 nm range (black arrow), with areas of mild (3-month-old mice) or severe (7-month-old mice) irregular thickening (white arrows), consistent with AS nephritis.
Figure 11.
Figure 11.
The UPR pathway is activated in whole kidney lysates of Col4a3-G1332E mice. (A) XBP1 splicing assay using RNA from whole kidney lysate from WT, Col4a3-G1332E heterozygous (WT/M), and Col4a3-G1332E homozygous (M/M) mice. Splicing is evident by the presence of the lower-molecular-weight band on 2% agarose gel. Mouse glyceraldehyde 3-phosphate dehydrogenase is used as control. Notice the presence of the spliced band in the heterozygous (WT/M) and homozygous (M/M) mice. (B) Real-time PCR for direct quantitation of the spliced XBP1 isoform using primers in the spliced–unspliced interface. Significance is not reached, but there is an obvious trend toward spliced XBP1 increase in homozygous (M/M) mice. Data are means±SEM of three independent experiments. (C) Examination of BiP and CHOP mRNA levels by qPCR. RNAs were extracted from whole kidney tissue of WT, Col4a3-G1332E heterozygous (WT/M), and Col4a3-G1332E homozygous (M/M) mice. Shown is significant upregulation of the BiP but not CHOP mRNA levels. (D) Representative Western blot to demonstrate protein expression level change in the homogenates of whole kidney lysate from 3-month-old WT or Col4a3-G1332E heterozygous (WT/M) or homozygous (M/M) knock-in mice. Equal amounts of protein homogenates were resolved by SDS-PAGE followed by Western blot. The blots in each panel came from the same gel. Notice differential expression of proteins between WT and mutant mice. (E) Quantification of representative blots as in D is shown in graphic form. The expression levels of BiP, CHOP, p-PERK, and p-eIF2α were normalized to β-tubulin levels (*P<0.05; **P<0.01, n≥3); M/M, homozygous for the Col4a3-G1332E mutation; WT/M, heterozygous for the Col4a3-G1332E mutation. Three mice were used for each condition. All UPR genes except CHOP were significantly overexpressed. h, hybrid; sXBP1, spliced XBP1; uXBP1, unspliced XBP1.
Figure 12.
Figure 12.
Upregulation of UPR marker mRNA in glomeruli isolated from Col4a3-G1332E knock-in mice. (A) Examination of BiP and CHOP mRNA levels by qPCR. RNAs were extracted from isolated mouse glomeruli of WT and Col4a3-G1332E homozygous mutant (M/M) mice. Shown is significant upregulation of the BiP but not CHOP mRNA levels. Spliced XBP1 mRNA levels show an obvious increase trend. (B) Representative experiment of reverse transcription PCR of the XBP1 mRNA in RNA isolated from WT or mutant mice glomeruli. PCR products were run on 3% agarose gel. It is apparent that there is induction of XBP1 splicing in mutant mice, as evidenced by the appearance of the smaller spliced form (sXBP1). The spliced molecules are smaller by 26 bp. Mouse glyceraldehyde 3-phosphate dehydrogenase is used as control. M/M, homozygous mouse; WT/M, heterozygous mouse; WT/WT, WT mice. *P<0.05; n=3.

References

    1. Haas M: Alport syndrome and thin glomerular basement membrane nephropathy: a practical approach to diagnosis. Arch Pathol Lab Med 133: 224–232., 2009 - PubMed
    1. Thorner PS: Alport syndrome and thin basement membrane nephropathy. Nephron Clin Pract 106: c82–c88, 2007 - PubMed
    1. Temme J, Peters F, Lange K, Pirson Y, Heidet L, Torra R, Grunfeld JP, Weber M, Licht C, Müller GA, Gross O: Incidence of renal failure and nephroprotection by RAAS inhibition in heterozygous carriers of X-chromosomal and autosomal recessive Alport mutations. Kidney Int 81: 779–783, 2012 - PubMed
    1. Voskarides K, Damianou L, Neocleous V, Zouvani I, Christodoulidou S, Hadjiconstantinou V, Ioannou K, Athanasiou Y, Patsias C, Alexopoulos E, Pierides A, Kyriacou K, Deltas C: COL4A3/COL4A4 mutations producing focal segmental glomerulosclerosis and renal failure in thin basement membrane nephropathy. J Am Soc Nephrol 18: 3004–3016, 2007 - PubMed
    1. Parkin JD, San Antonio JD, Pedchenko V, Hudson B, Jensen ST, Savige J: Mapping structural landmarks, ligand binding sites, and missense mutations to the collagen IV heterotrimers predicts major functional domains, novel interactions, and variation in phenotypes in inherited diseases affecting basement membranes. Hum Mutat 32: 127–143, 2011 - PMC - PubMed

Publication types

MeSH terms