. 2013 Nov 21;4(11):e926.
doi: 10.1038/cddis.2013.452.

Argonaute 2 sustains the gene expression program driving human monocytic differentiation of acute myeloid leukemia cells

Affiliations

Argonaute 2 sustains the gene expression program driving human monocytic differentiation of acute myeloid leukemia cells

I Iosue et al. Cell Death Dis. .

Abstract

MicroRNAs are key regulators of many biological processes, including cell differentiation. These small RNAs exert their function assembled in the RNA-induced silencing complexes (RISCs), where members of Argonaute (Ago) family of proteins provide a unique platform for target recognition and gene silencing. Here, by using myeloid cell lines and primary blasts, we show that Ago2 has a key role in human monocytic cell fate determination and in LPS-induced inflammatory response of 1,25-dihydroxyvitamin D3 (D3)-treated myeloid cells. The silencing of Ago2 impairs the D3-dependent miR-17-5p/20a/106a, miR-125b and miR-155 downregulation, the accumulation of their translational targets AML1, VDR and C/EBPβ and monocytic cell differentiation. Moreover, we show that Ago2 is recruited on miR-155 host gene promoter and on the upstream region of an overlapping antisense lncRNA, determining their epigenetic silencing, and miR-155 downregulation. These findings highlight Ago2 as a new factor in myeloid cell fate determination in acute myeloid leukemia cells.


Figures
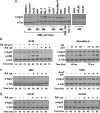
Figure 1
Figure 1
Ago2 protein levels in human AML cell lines and during myeloid differentiation. (a) Immunoblot analysis for the detection of Ago2 in the indicated AML cell lines classified by FAB (AML-M0 to AML-M7) according to their morphologic and cytochemical characteristics and in primary blasts from BM (APL#1) and PB (APL#2) of two newly diagnosed APL cases. CML-BC and ALL are chronic myelogenous leukemia in blast crisis and acute lymphocytic leukemia cell lines, respectively. (b) Immunoblot analysis for the detection of vitamin D receptor (VDR) and Ago2 in the myeloblastic HL-60 cell line treated or not with 1 μM of retinoic acid (RA) or with 250 ng/ml of 1,25-dihydroxyvitamin D3 (D3) at the indicated times (left panels) or in the monocytic MonoMac-6 cell line after treatment for 48 or 72 h with increasing doses of D3 (2.5–25–250 ng/ml) (right panels). (c and d) Immunoblot analysis for the detection of Ago2 in NB4 (APL-M3) and CML-BC K562 cell lines treated or not with 1 μM of RA or ARA-C as indicated and in primary blasts described in (A) prior or after in vitro treatment with RA (1 μM). The levels of tubulin visualized an equal amount of protein loading. Densitometric analysis is reported in Supplementary Figure 1
Figure 2
Figure 2
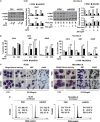
Ago2 depletion decreases the differentiation response to 1,25-dihydroxyvitamin D3 of the human myeloblastic (HL60) or monocytic (MonoMac-M6) cell lines. HL60 (left) and MonoMac-6 (right) cells were infected with an empty lentiviral vector (PGK) or with one expressing shRNAs targeting Ago2 (siAgo2). (a) Ago-2 and VDR protein expression levels were analyzed by western blot performed after 96 h of D3 (2.5–250 ng/ml) treatment on total cell lysates (30 μg) from HL60 and after 72 and 96 h of D3 treatment (250 ng/ml) on total cell lysates (30 μg) from MonoMac-6. The graphs on the right of each blot show the respective densitometric analysis in which tubulin was used for normalization. (b) Differentiation of HL60 (left) and MonoMac-6 treated or not with the indicated doses of D3 was evaluated by the expression of the monocytic marker CD14, using the NBT dye reduction assay and by cytochemical staining for the α-naphthyl acetate esterase (ANAE) activity. CD14 expression was assessed by flow cytometry 72 h after the treatments, whereas the NBT reduction and the ANAE activity after 96 h (n=3±S.E.M.). Statistical analysis was performed by the Student's t-Test (*P value <0.05, **P value <0.005, ***P value <0.0005). (c) Light microscopy fields showing morphological changes of HL60 (left) and MonoMac-6 (right) PGK and siAgo2 cells after 96 h of D3 treatment (250 ng/ml) after Wright-Giemsa staining and representative fields of the NBT and ANAE assays analyzed in (b and d). Cell cycle analysis performed by flow cytometry on HL60 (left) and MonoMac-6 (right) PGK and siAgo2 cells after 96 h of D3 treatment (250 ng/ml)
Figure 3
Figure 3
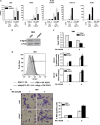
Ago2 silencing promotes RA-induced granulocytic differentiation. (a) Dose-dependent expression levels of genes associated with D3-induced monocytic (MSE, MafB and M-CSFr) or RA-induced granulocytic (TGaseII and RARβ) differentiation of HL60 PGK or siAgo2 cells evaluated by qRT-PCR analysis. mRNA amounts were evaluated after 72 h of the indicated treatment and normalized with GAPDH values using the ΔΔCt method (n=3±S.D.). (b) NB4 cells were infected with an empty (PGK) or a shAgo2 lentiviral vector (siAgo2), and the decrease in Ago2 protein levels was measured by western blot. (c) The amount of Ago2 mRNA was assessed by qRT-PCR in PGK or siAgo2 cells induced or not to differentiate by RA. Analysis of the data was performed by the ΔΔCt method using GAPDH for normalization of the samples. (d) Levels of expression of the surface molecule CD11b during RA-induced granulocytic differentiation of PGK or siAgo2 NB4 cells assessed by flow cytometry. On the left panel an overlay histogram of a representative experiment is shown, whereas on the right panel the graphs report the average fold increase of the percentage of positive cells and of the mean fluorescence intensity (MFI) (n=2±S.E.M.). (e) NBT dye reduction assay of PGK or siAgo2 NB4 cells. The pictures show typical fields of untreated (RA-) or treated (RA+) NB4 cells. The graph reports the NBT-positive cell counts evaluated after 72 h of treatment of a representative experiment
Figure 4
Figure 4
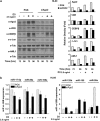
Transcription factors and miRNAs expression during D3-dependent monocyte differentiation. (a) Western blot analysis for the detection of the indicated proteins was performed in HL60 PGK and siAgo2 cells after 72 and 96 h of D3 treatment (2.5 ng/ml). The graphs on the right show the densitometric analysis of the blots in which tubulin was used for normalization. Detection of AML-1 was performed on a different nitrocellulose filter relatively to the other proteins, and thus tubulin detected on this filters is shown (bottom row). (b) After 72 h of D3 treatment, 10 ng of total RNA from HL60 PGK and siAgo2 cells was retrotranscribed specifically for each indicated miRNAs, and the relative quantification of their expression was measured by qRT-PCR using the ΔΔCt method. Values were normalized to RNU6B as a housekeeping gene (n=3±S.D.)
Figure 5
Figure 5
miR-155HG (BIC) and antisense lncRNA-155HG (lncRNA) regulation during monocytic cell differentiation. (a) Schematic representation of the genomic structure of human miR-155 gene as reported by the UCSC Genome Browser website (http://genome.ucsc.edu/). The exon sequences (E) on the miR-155 gene are numbered (1–3), and the localization of miR-155 mature sequence on E3 is indicated. Arrows indicate the location of the primers used in the ChiP assay, primers 1 for the region upstream miR-155HG and primers 2 for that of lncRNA-155HG. (b) After 72 h of D3 treatment total RNA from HL60 PGK and siAgo2 cells was retrotrascribed, and the relative quantification of BIC or lncRNA expression was measured by qRT-PCR using the ΔΔCt method. Values were normalized to RNU6B as a housekeeping gene (n=3±S.D.). (c) Histograms of the qRT-PCR performed to amplify BIC and lncRNA regions in ChIP assays carried out using an anti-acetyl-Histone-H4 antibody on chromatin samples prepared from HL60-PGK and HL60-siAgo2 cells. Samples were quantified versus the respective input and calculated following the 2−ΔΔCt method (n=3±S.D.). (d) Dose-dependent evaluation of BIC and lncRNA expression associated with D3-induced monocytic differentiation of HL60 cells. RNA amounts were evaluated after 72 h of treatment, and the relative quantification of their expression was measured by qRT-PCR using the ΔΔCt method. Values were normalized to RNU6B as a housekeeping gene (n=3±S.D.). (e and f) Histograms of the qRT-PCR performed to amplify BIC and lncRNA regulatory regions in ChIP assays carried out using an anti-Ago2 antibody (e) or an anti-acetyl-Histone-H4 antibody (f) on chromatin samples prepared from HL60 cells after 72 h of D3 treatment (250 ng/ml). Samples were quantified versus the respective input and calculated following the ΔΔCt method (n=3±S.D.)
Figure 6
Figure 6
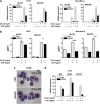
Evaluation of cytokine expression following LPS stimulation in D3-treated human myeloid cells. (a) The macrophage (M-CSF) and the granulocyte-macrophage (GM-CSF) colony-stimulating factor mRNA levels evaluated in HL60 (left) and MonoMac-6 (right) PGK and siAgo2 cells following 72 h of LPS (1 μg/ml) and D3 (2.5 ng/ml) treatment as single agents or combination. The relative expression was measured in qRT-PCR using the ΔΔCt method. Values were normalized to GAPDH as a housekeeping gene (n=3±S.D.). (b) M-CSF and GM-CSF levels in media collected after 96 h of cultures of HL60 (left) and MonoMac-6 (right) PGK and siAgo2 cells treated or not with LPS (1 μg/ml) plus D3 (2.5 ng/ml) (n=3±S.E.M.). Statistical analysis was performed by the Student's t-Test (*P value <0.05, ***P value <0.0005). (c) Morphological changes assessed by light-field microscopy of Wright-Giemsa stained HL60 PGK and siAgo2 cells after 96 h of D3 treatment (2.5 ng/ml) plus LPS stimulation (1 μg/ml). (d) Expression levels of genes associated with monocytic differentiation (MSE, MafB and M-CSFr) evaluated in HL60 PGK or siAgo2 cells following LPS (1 μg/ml) stimulation as single agents or in combination with D3 treatment (2.5 ng/ml). mRNA amounts were evaluated by qRT-PCR analysis after 72 h of the indicated treatment and normalized with GAPDH using the ΔΔCt method (n=3±S.D.)

Similar articles

Cited by

References

    1. Rosenbauer F, Tenen DG. Transcription factors in myeloid development: balancing differentiation with transformation. Nat Rev Immunol. 2007;7:105–117. - PubMed
    1. Fazi F, Nervi C. MicroRNA: basic mechanisms and transcriptional regulatory networks for cell fate determination. Cardiovasc Res. 2008;79:553–561. - PubMed
    1. García P, Frampton J. Hematopoietic lineage commitment: miRNAs add specificity to a widely expressed transcription factor. Developmental cell. 2008;14:815–816. - PubMed
    1. Chen J, Odenike O, Rowley JD. Leukaemogenesis: more than mutant genes. Nat Rev Cancer. 2010;10:23–36. - PMC - PubMed
    1. Bennett JM, Catovsky D, Daniel MT, Flandrin G, Galton DA, Gralnick HR, et al. Proposed revised criteria for the classification of acute myeloid leukemia. A report of the French-American-British Cooperative Group. Ann Intern Med. 1985;103:620–625. - PubMed

Publication types

MeSH terms