. 2014 Jan;4(1):80-93.
doi: 10.1158/2159-8290.CD-13-0642. Epub 2013 Nov 21.

Acquired resistance and clonal evolution in melanoma during BRAF inhibitor therapy

Affiliations

Acquired resistance and clonal evolution in melanoma during BRAF inhibitor therapy

Hubing Shi et al. Cancer Discov. 2014 Jan.

Abstract

BRAF inhibitors elicit rapid antitumor responses in the majority of patients with BRAF(V600)-mutant melanoma, but acquired drug resistance is almost universal. We sought to identify the core resistance pathways and the extent of tumor heterogeneity during disease progression. We show that mitogen-activated protein kinase reactivation mechanisms were detected among 70% of disease-progressive tissues, with RAS mutations, mutant BRAF amplification, and alternative splicing being most common. We also detected PI3K-PTEN-AKT-upregulating genetic alterations among 22% of progressive melanomas. Distinct molecular lesions in both core drug escape pathways were commonly detected concurrently in the same tumor or among multiple tumors from the same patient. Beyond harboring extensively heterogeneous resistance mechanisms, melanoma regrowth emerging from BRAF inhibitor selection displayed branched evolution marked by altered mutational spectra/signatures and increased fitness. Thus, melanoma genomic heterogeneity contributes significantly to BRAF inhibitor treatment failure, implying upfront, cotargeting of two core pathways as an essential strategy for durable responses.


Figures
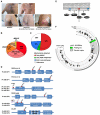
Figure 1
Figure 1
Core melanoma escape pathways during disease progression on BRAF Inhibitor therapy. A, Representative photographs (patient #25) of initial vemurafenib response, incomplete response or residual and later acquired BRAFi resistance, which occurred at a site of incompletely shrunken tumor. B, The relative distribution of MAPK-reactivating mechanisms among disease progressive melanomas where such mechanisms were detected. C, The relative distribution of core pathways (MAPK vs. PI3K-PTEN-AKT) and hitherto unknown mechanisms among all melanomas featuring disease progression. D, Non-synonymous mutations in the PI3K-PTEN-AKT core drug escape pathway detected only in disease progression (DP) tumors. The schematics show the locations of mutations in the protein domain structures and their corresponding source patients and tissues. E, Signaling schematics of PI3K-PTEN-AKT pathway components mutated in biopsies of growing melanomas with acquired BRAF inhibitor resistance (PIK3CA, p110; PIK3R2, p85). F, Focal copy number loss of PTEN in DP melanoma of patient #11.
Figure 2
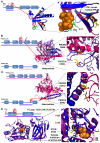
Figure 2. Structure-function models of novel mutants in the PI3K-AKT pathway
A, Schematic protein domains of AKT showing locations of E17K (AKT3) and Q79K (AKT1) substitutions in the PHD (underlined portion represented in 3D). Merged structures of Apo Q79KAKT1 (purple) and IP4-bound Q79KAKT1 (blue) with zoomed-in image (PIP4, orange) showing locations of E17 (green) and relative positions of WT Q79 (yellow) and mutant K79 (red). B, Schematic protein domains of PIK3CA (p110α) and PIK3R2 (p85) showing locations of the PIK3CA D350G (C2 domain) and E545G (helical domain) substitutions. Underlined portions of PIK3CA and homologous PIK3R1 represented as a 3D hetero-dimer (PIK3CA WT, purple; PIK3CA D350G, blue; niSH2 domain of PIK3R1 (p85α), magenta). A zoomed-in view of the interface between the C2 domain of PIK3CA and niSH2 domain of PIK3R2 suggesting the D350G (D350 yellow; G350 red) substitution likely abolishes a critical interaction with the highly conserved S565 (orange) of PIK3R2. C, Schematic protein domains of PIK3CA (p110α) and PIK3R2 (p85) showing location of the PIK3R2 N561D substitution in the iSH helical linker domain. PIK3CA WT (aa 31-515; magenta) in complex with a merged niSH2 domain structure of PIK3R2 WT (purple) and PIK3R2 N561D (blue). A zoomed-in view of the interface between the C2 domain of PIK3CA and niSH2 domain of PIK3R2 showing the interaction between PIK3R2 N561 (yellow) and PIK3CA N345 (orange) being disrupted by the PIK3R2 N561D mutant (red). D, Schematic protein domains of PTEN showing the locations of the frameshift mutation in codon 40 and the deletion of M134. Merged structures of the full-length PTEN WT (purple) with M134 highlighted (yellow) and PTEN M134del (blue) in the dual-specificity phosphatase domain bound by the inhibitor tartrate (orange). A zoomed-in view showing how deletion of the highly conserved M134 (yellow) may destabilize an alpha helical structure proximal to the P loop and alters the critical side chain conformations of the P loop, which is critical for phosphatase activity.
Figure 3
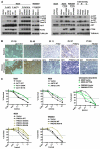
Figure 3
Genetic alterations in the PI3K-PTEN-AKT pathway detected during disease progression and their functional impacts. A, Immunoblotting of protein lysates from V600EBRAF human melanoma cell lines (M229, WM2664, M249 and VUB MEL A, B, and C) stably expressing the indicated wild type or mutant genes and their impacts on phospho-AKT (also shown are total levels and TUBULIN serving as loading controls). B, Phospho-AKT (Ser473; brown, left two panels; grey/black, right threepanels) staining by immunohistochemistry (bar, 50 μM) in melanoma tissues harboring indicated genetic alterations in the PI3K-PTEN-AKT pathway during disease progression (relative to staining in melanomas before BRAF inhibitor therapy). C, The effects of stable over-expression of indicated AKT1/3, PIK3CA, PIK3R2 and PTEN constructs or stable PTEN knockdown (vs. empty vectors) on cellular sensitivity to vemurafenib-mediated growth suppression (error bars, SEM; P values of logEC50 of each construct vs. vector: AKT1 WT 0.2984, E17K 0.0006, Q79K 0.0001; AKT3 WT 0.0064, E17K 0.0033; PIK3CA WT < 0.0001, D350G 0.0148, E545G < 0.0001, E545K < 0.0001; PIK3R2 WT 0.8262, N561D < 0.0001).
Figure 4
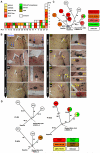
Figure 4
Melanoma heterogeneity and branched evolution during the acquisition of BRAF inhibitor resistance. A, Detection of molecular mechanisms of acquired BRAF inhibitor resistance, grouped into core escape pathways, among temporally and geographically distinct disease progression (DP) melanoma biopsies from 16 patients. Intra-tumoral sub-clone heterogeneity vs. concurrence of molecular alterations cannot be distinguished in this analysis. B, Time course of metastatic melanomas to the skin in patient #37 responding to the BRAF inhibitor dabrafenib and the timing and sites of thirteen tumor biopsies (two baseline, two residual disease (RD) melanomas, and nine DP melanomas). Zoomed-in photographs highlight protuberant growths of specific metastatic foci, which together show temporal accretion of disease progression events. C, The phylogenetic relationships of the distinct baseline and DP melanomas in patient #37. Branch lengths are proportional to the number of somatic single nucleotide variants or SNVs (and INDELs in parenthesis) separating the branching points, and the sum of these SNVs and INDELs represent the collection of somatic variants unique or private in at least one tumor. The individual DP melanomas are color-coded by detection of distinct driver mechanisms of acquired BRAF inhibitor resistance. D, Whole-exome phylogenetic trees of tumor biopsies from additional patients (in addition to Pt #37) who donated multiple DP samples. In all three patients, DP tumors from the same patient displayed genomic diversification in a branching pattern. Pt #22 DP2 harbored a KRAS G12R mutation while DP3 harbored a KRAS Q61H mutation, consistent with the tree showing the two DP tumors diverging early and independently acquiring distinct KRAS mutations (i.e., convergent evolution). Pt #22 DP1, which arose from the same sub-branch as DP2, acquired an activating MEK1 mutation (K57N) instead of a KRAS mutation. Pt #24 DP1 harbored a loss-of-function mutation in PIK3R2 as well as mutant BRAF alternative splicing, while the mechanism(s) of acquired resistance in DP2/3 remains unknown. Consistently, the tree branching pattern/distances indicate that DP1-3 shared few common mutations.
Figure 5
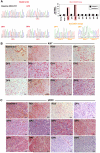
Figure 5
Correlation between genotypes and phenotypes in melanoma biopsies from Patient #37. A, The detection of specific driver alterations in distinct disease progression (DP) melanomas and their relationships to the levels of Ki-67 (B) and p-ERK (C) detected by immunohistochemical staining (bar, 50 μM). Baseline 2 tumor, FFPE not available.
Figure 6
Figure 6
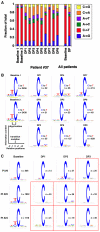
The mutational spectra and signatures before versus after BRAF inhibitor therapy. A, The altered mutational spectra of baseline vs. DP melanomas in patient #37 as well as in all baseline vs. all DP melanomas with whole-exome sequence data (baseline tumors n = 22; DP tumors n = 44; Student t-test on the distributions of median fractions of A > G, C > T, A > C, A >T, C > A, C > G between baseline and DP were respectively 3.22×10⁻⁸, 1.38×10⁻¹³, 6.91×10⁻⁵, 4.09×10⁻³, 1.32×10⁻¹⁰, and 1.50×10⁻⁵). B, Detection of a dipyrimidine motif of C > T transitions (UV signature) in the baseline but not the DP melanomas of patient #37. Instead, certain DP melanomas displayed C > T transitions occurring in the CG dinucleotide motif. Motif analyses were centered on the C > T transitions and inclusive of −2 and +2 nucleotides. C, Detection of a dipyrimidine motif of C > T transitions (UV signature) in the baseline tumors but not in the majority of patient-matched DP tumors in three additional patients with multiple biopsies during disease progression. Instead, certain DP melanomas displayed C > T transitions occurring in the CG dinucleotide motif. Together with the observations made in Pt #37 (B), the loss of baseline-somatic dipyrimidine C>T UV signature mutations (among the DP-specific mutations, highlighted in red boxes in C) was estimated to occur at a frequency of 56%.

Comment in

References

    1. Davies H, Bignell GR, Cox C, Stephens P, Edkins S, Clegg S, et al. Mutations of the BRAF gene in human cancer. Nature. 2002 Jun 27;417(6892):949–54. - PubMed
    1. Chapman PB, Hauschild A, Robert C, Haanen JB, Ascierto P, Larkin J, et al. Improved survival with vemurafenib in melanoma with BRAF V600E mutation. N Engl J Med. 2011 Jun 30;364(26):2507–16. - PMC - PubMed
    1. Flaherty KT, Puzanov I, Kim KB, Ribas A, McArthur GA, Sosman JA, et al. Inhibition of mutated, activated BRAF in metastatic melanoma. N Engl J Med. 2010 Aug 26;363(9):809–19. - PMC - PubMed
    1. Hauschild A, Grob JJ, Demidov LV, Jouary T, Gutzmer R, Millward M, et al. Dabrafenib in BRAF-mutated metastatic melanoma: a multicentre, open-label, phase 3 randomised controlled trial. Lancet. 2012 Jul 28;380(9839):358–65. - PubMed
    1. Sosman JA, Kim KB, Schuchter L, Gonzalez R, Pavlick AC, Weber JS, et al. Survival in BRAF V600-mutant advanced melanoma treated with vemurafenib. N Engl J Med. 2012 Feb 23;366(8):707–14. - PMC - PubMed

Publication types

MeSH terms