. 2014 Jan 10;289(2):654-68.
doi: 10.1074/jbc.M113.523274. Epub 2013 Nov 21.

Mechanism of bacterial interference with TLR4 signaling by Brucella Toll/interleukin-1 receptor domain-containing protein TcpB

Affiliations

Mechanism of bacterial interference with TLR4 signaling by Brucella Toll/interleukin-1 receptor domain-containing protein TcpB

Mohammed Alaidarous et al. J Biol Chem. .

Abstract

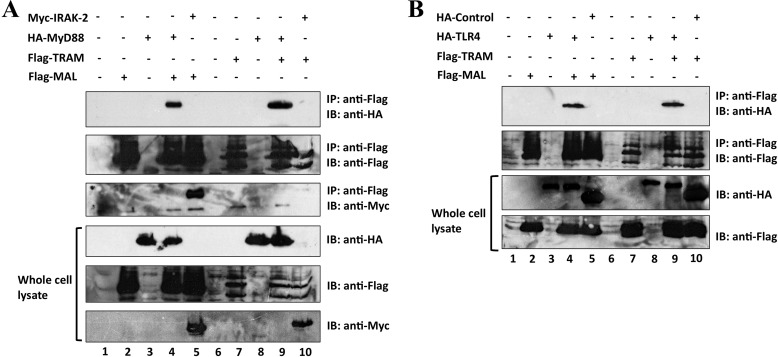
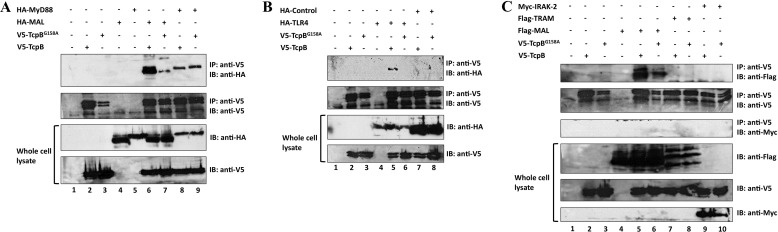
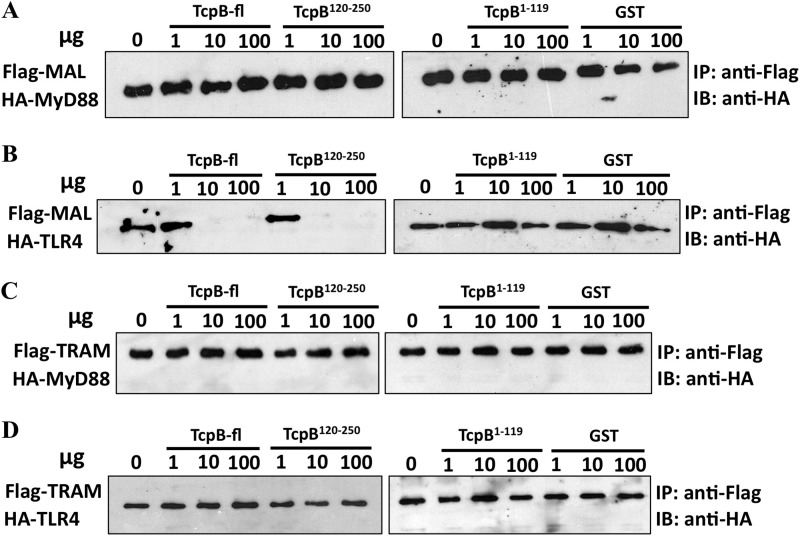
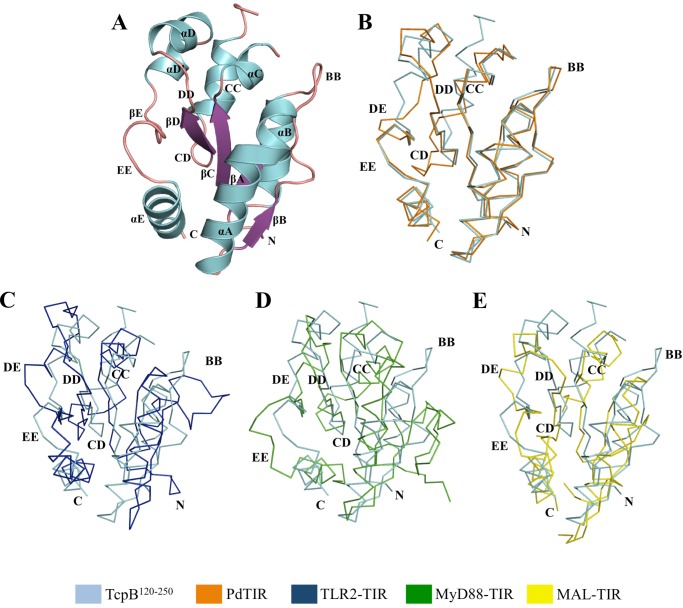
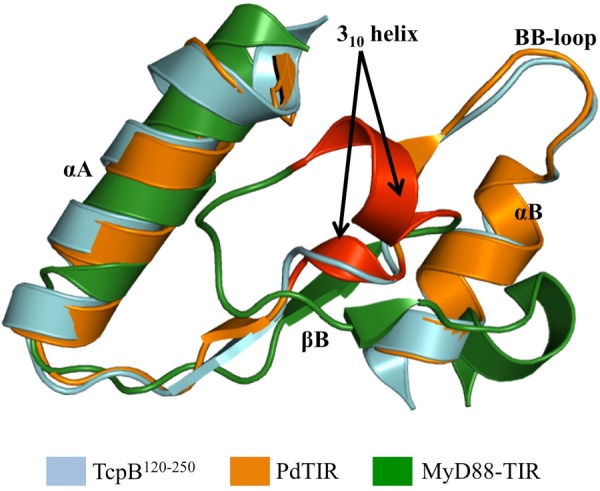
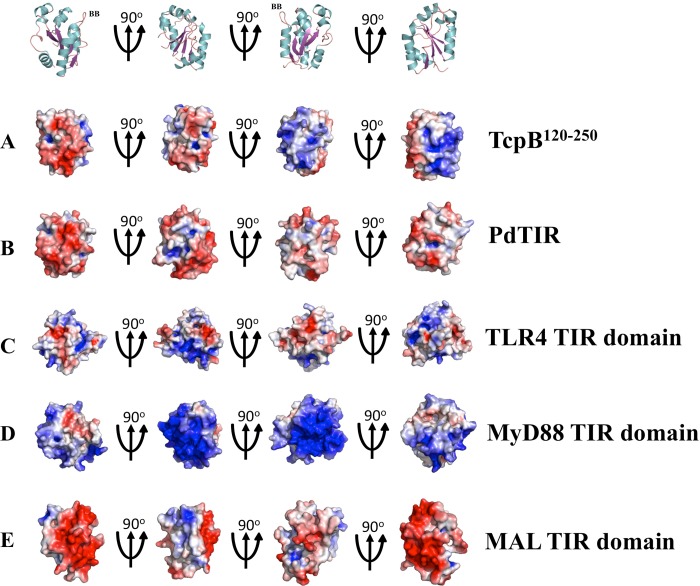
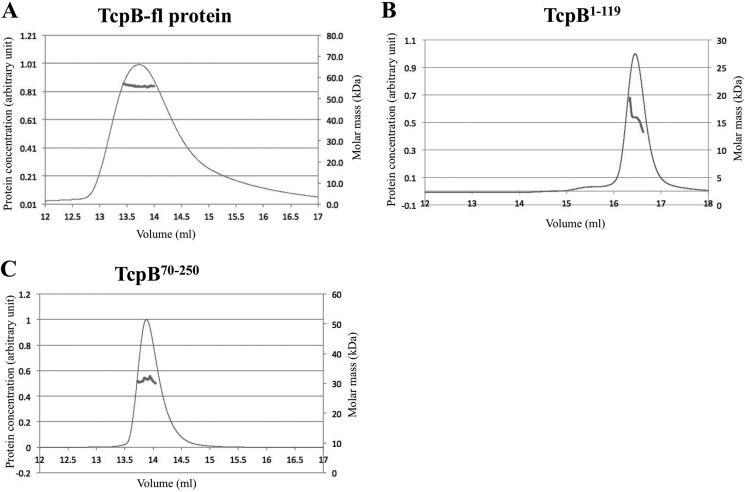
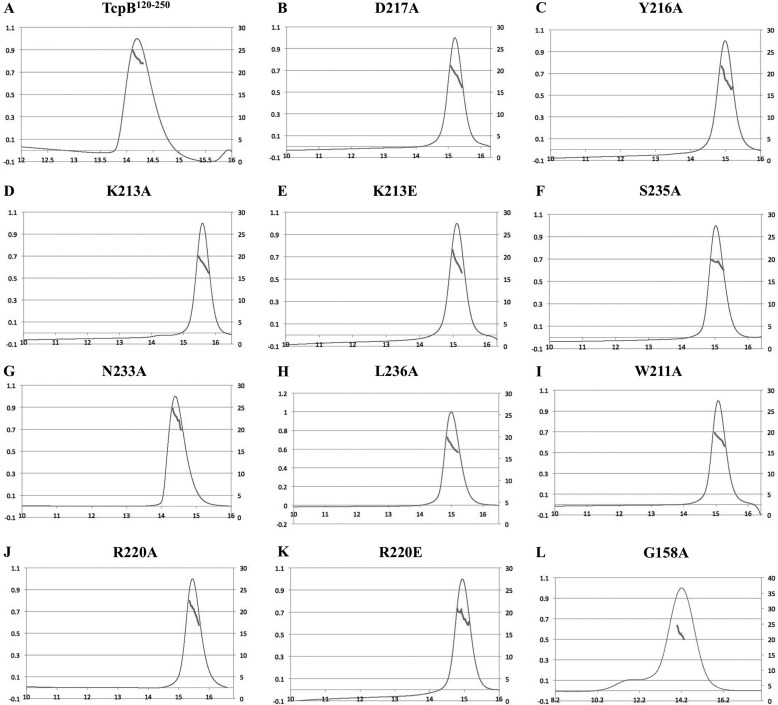
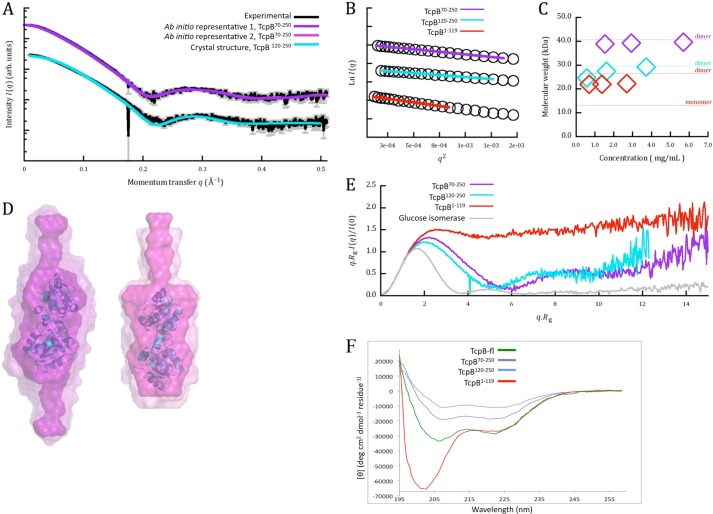
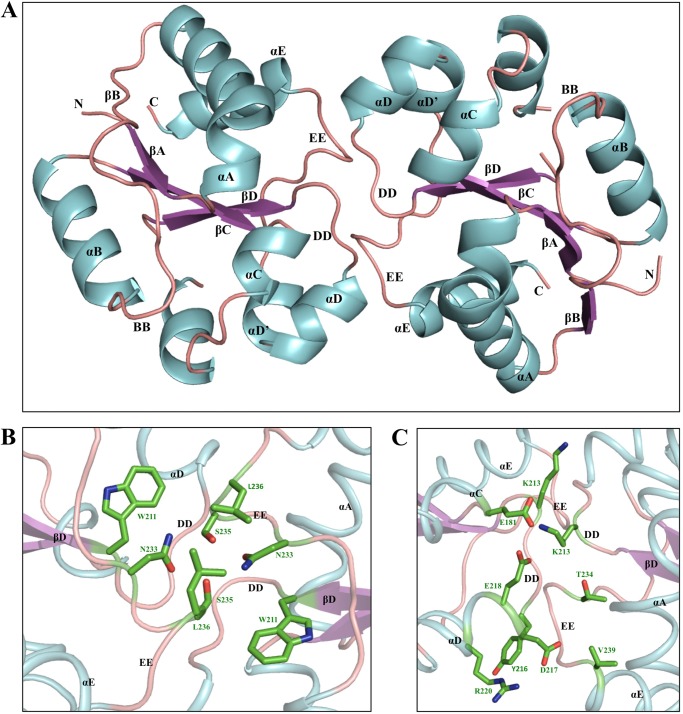
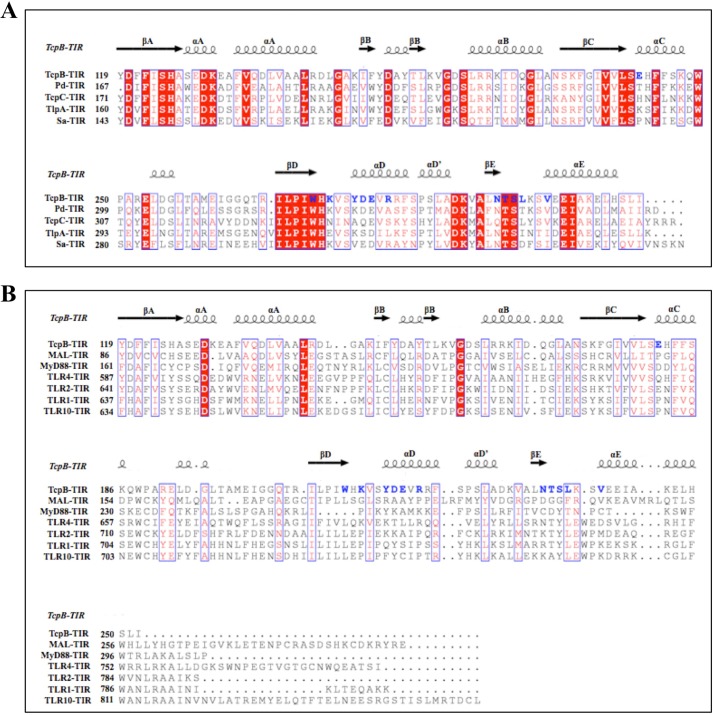
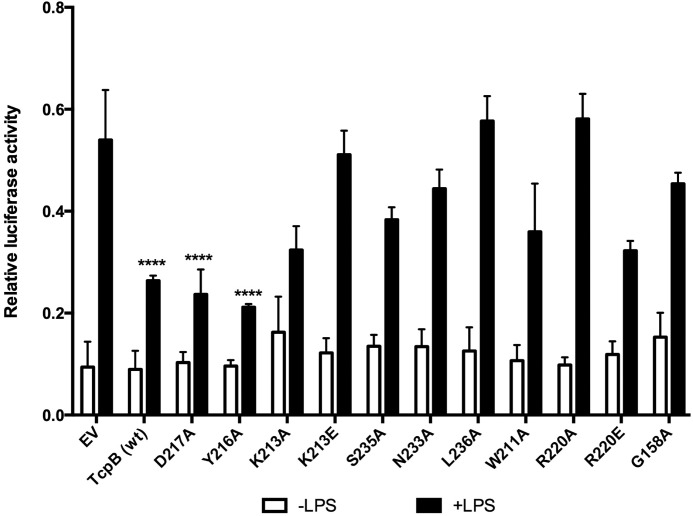
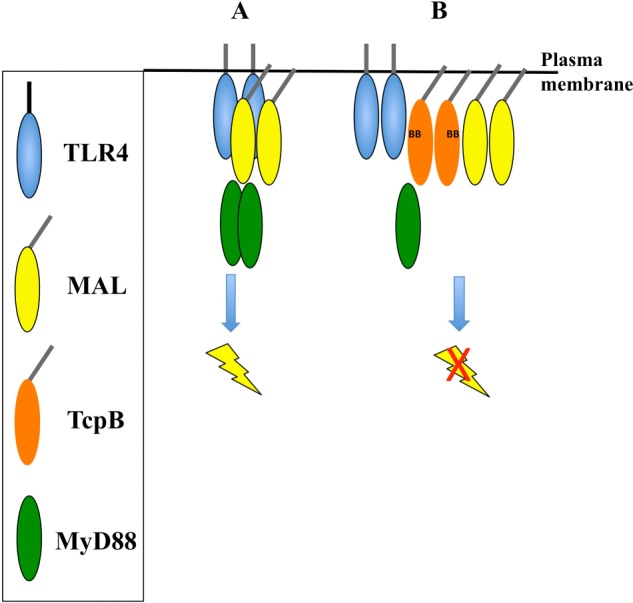
Upon activation of Toll-like receptors (TLRs), cytoplasmic Toll/interleukin-1 receptor (TIR) domains of the receptors undergo homo- or heterodimerization. This in turn leads to the recruitment of adaptor proteins, activation of transcription factors, and the secretion of pro-inflammatory cytokines. Recent studies have described the TIR domain-containing protein from Brucella melitensis, TcpB (BtpA/Btp1), to be involved in virulence and suppression of host innate immune responses. TcpB interferes with TLR4 and TLR2 signaling pathways by a mechanism that remains controversial. In this study, we show using co-immunoprecipitation analyses that TcpB interacts with MAL, MyD88, and TLR4 but interferes only with the MAL-TLR4 interaction. We present the crystal structure of the TcpB TIR domain, which reveals significant structural differences in the loop regions compared with other TIR domain structures. We demonstrate that TcpB forms a dimer in solution, and the crystal structure reveals the dimerization interface, which we validate by mutagenesis and biophysical studies. Our study advances the understanding of the molecular mechanisms of host immunosuppression by bacterial pathogens.

Keywords: Adaptor Proteins; Innate Immunity; Protein Structure; Toll IL-1 Receptor (TIR) Domain; Toll-like Receptors (TLR).


Figures

FIGURE 1.
FIGURE 1.
Western blot analysis of controls for co-immunoprecipitation analysis. Using Lipofectamine 2000, HEK293 cells (1 × 10⁶ cells/well) were co-transfected with 1 μg of FLAG-MAL and 1 μg of HA-MyD88 (A, lane 4) or 1 μg of Myc-IRAK-2 (A, lane 5); 1 μg of FLAG-TRAM and 1 μg of HA-MyD88 (A, lane 9) or 1 μg of Myc-IRAK-2 (A, lane 10); 1 μg of FLAG-MAL and 1 μg of HA-TLR4 (B, lane 4) or HA-tagged control (B, lane 5); and 1 μg of FLAG-TRAM and 1 μg of HA-TLR4 (B, lane 9) or HA-tagged control (B, lane 10). The lysates were immunoprecipitated with anti-FLAG-M2 antibody bound to prewashed Dynabeads® protein G magnetic beads, followed by a 2-h incubation at 4 °C with rotation. Beads were then subjected to washing, SDS-PAGE, and immunoblotting with the indicated antibodies. Data in A and B were generated in the same experiment, and both panels are representative of two independent experiments. Notably, MAL-IRAK-2, MyD88-IRAK-2, and TRAM-MyD88 interactions have been reported previously (–59).
FIGURE 2.
FIGURE 2.
Co-immunoprecipitation of TcpB with MAL, MyD88, and TLR4. HEK293 cells (1 × 10⁶ cells/well) were co-transfected using Lipofectamine 2000 with 1 μg of V5-TcpB or V5-TcpBG158A and 1 μg of HA-MAL (A, lanes 6 and 7), HA-MyD88 (A, lanes 8 and 9), HA-TLR4 (B, lanes 5 and 6), HA-tagged control protein (B, lanes 7 and 8), FLAG-TRAM (C, lanes 7 and 8) or Myc-IRAK-2 (C, lanes 9 and 10). After 24 h, the lysates were immunoprecipitated with anti-V5 antibody bound to prewashed Dynabeads® protein G magnetic beads, followed by a 2-h incubation at 4 °C with rotation. Beads were then subjected to washing, SDS-PAGE, and immunoblotting with the indicated antibodies. Data in A–C were generated in the same experiment, and all panels are representative of two independent experiments.
FIGURE 3.
FIGURE 3.
Effect of recombinant TcpB on the interaction between MAL-MyD88, MAL-TLR4, TRAM-MyD88, and TRAM-TLR4. HEK293 cells (1 × 10⁶ cells/well) were co-transfected using Lipofectamine 2000 with 1 μg of FLAG-MAL with 1 μg of HA-MyD88 (A) or 1 μg of HA-TLR4 (B) and with 1 μg of FLAG-TRAM with 1 μg of HA-MyD88 (C) or 1 μg of HA-TLR4 (D). After 24 h of transfection, the lysates were immunoprecipitated with anti-FLAG-M2 bound to prewashed Dynabeads® protein G magnetic beads, followed by a 2-h incubation at 4 °C with rotation. Increasing amounts (1, 10, and 100 μg) of recombinant TcpB-fl (A–D, lanes 2–4), TcpB120–250 (A–D, lanes 5–7), TcpB1–119 (A–D, lanes 9–11), or GST (A–D, lanes 12–14) were added and incubated for 3 h at 4 °C with rotation. Beads were then subjected to washing, SDS-PAGE, and immunoblotting with the indicated antibodies. Data are representative of two independent experiments.
FIGURE 4.
FIGURE 4.
Crystal structure of the TcpB TIR domain and comparison with available TIR domain structures. A, cartoon representation of the TcpB120–250 crystal structure, colored by secondary structure elements (α-helices, blue; β-sheet, purple; loop regions, pink). B–E, ribbon representations of the superposition of TcpB120–250 (cyan) with PdTIR (B, orange) (Protein Data Bank code 3h16) and the TIR domains from TLR2 (C, blue) (Protein Data Bank code 1fyw), MyD88 (D, green) (Protein Data Bank code 4dom), and MAL (E, yellow) (Protein Data Bank code 2y92).
FIGURE 5.
FIGURE 5.
Superposition of TIR domains to highlight the differences in 310 helices. Superposition of the structure of TcpB120–250 (cyan), PdTIR (orange), and the TIR domain of MyD88 (green) is shown. The 310 helices are colored red, and this structural feature is only found in the structures of PdTIR and the MyD88 TIR domain and is missing from the TcpB120–250 structure.
FIGURE 6.
FIGURE 6.
Comparison of electrostatic properties. The solvent-accessible surfaces of TcpB120–250 (A), PdTIR (B), TLR4 TIR domain (C), MyD88 TIR domain (D), and MAL TIR domain (E) are colored according to electrostatic potential, ranging from blue (positive charge) through white to red (negative charge) in the range ± 0.5 kT/e. The electrostatic potential was calculated using the APBS tool within the PyMOL software (60). The upper panel is a cartoon representation of the TcpB120–250 structure in A, to help with the orientation of the structures. The TLR4 TIR domain structure was modeled using Phyre2 (49). TcpB120–250 has a distinctive positive charge across an area covering the βB, BB loop, and αB, compared with scattered negatively charged patches in PdTIR. The TIR domains from the mammalian proteins MyD88, MAL, and TLR4 are characterized by extensive positively or negatively charged patches across distant regions.
FIGURE 7.
FIGURE 7.
MALS analyses of TcpB-fl, TcpB1–119, and TcpB70–250. The traces show protein concentration (arbitrary units; thin lines) and the molecular mass distribution across the peaks (thick lines) for TcpB-fl (A), TcpB1–119 (B), and TcpB70–250 (C). Approximately 300 μg of each protein was used in a buffer containing 50 mm Hepes, pH 8.0, 250 mm NaCl, and 1 mm DTT.
FIGURE 8.
FIGURE 8.
MALS analyses of wild-type and mutant TcpB120–250. The traces show protein concentration (arbitrary units; thin lines) and the molecular mass distribution across the peaks (thick lines) for wild-type TcpB120–250 (A) and the D217A (B), Y216A (C), K213A (D), K213E (E), S235A (F), N233A (G), L236A (H), W211A (I), R220A (J), R220E (K), and G158A (L) mutants. Approximately 300 μg of each purified protein was used in a buffer containing 50 mm Hepes, pH 8.0, 250 mm NaCl, and 1 mm DTT.
FIGURE 9.
FIGURE 9.
Small-angle x-ray scattering data. A, experimental scattering from the TcpB70–250 and TcpB120–250 proteins is plotted in black, with 1σ error bars shown in gray, as I(q) versus q on an arbitrary, logarithmic scale. The fits of representative models from the two clusters of ab initio reconstructions are shown in purple on the TcpB70–250 curve, and calculated scattering from the crystallographic dimer is shown in cyan, fitting TcpB120–250 to a χ value of 5.8. B, highest concentration data sets for all three constructs, transformed as ln I(q) versus q2, demonstrating linearity over the ranges where q.Rg < 1.3. C, molecular masses are plotted for TcpB120–250, TcpB70–250, and TcpB1–119. Dotted lines indicate predicted molecular masses of dimeric and monomeric species where noted and are colored by construct. D, Representative (inner) and averaged (outer) ab initio models are shown in purple for the two clusters restored from TcpB70–250 modeling, as surface representation with van der Waals radii at 3 Å. The dimeric crystal structure in cartoon representation (cyan) is manually superimposed onto the globular domain. E, normalized, dimensionless Kratky plots are shown for the three constructs of TcpB and for a stable, globular standard, glucose isomerase. Increases at higher scattering angles indicating flexibility are observed in all constructs, with TcpB1–119 showing the most disorder. F, UV CD spectra (195–260 nm) of TcpB-fl (green), TcpB70–250 (purple), TcpB120–250 (cyan), and TcpB1–119 (red).
FIGURE 10.
FIGURE 10.
The TcpB120–250 TIR-TIR domain interface observed in the crystal structure. A, cartoon representation of the dimer interface. The interface involves the DD and EE loops and the αD and αE helices. B and C, detailed overview of the dimer interface. The side chains of key residues involved in close contacts are displayed in wire frame-representation. A 40% transparency has been applied to the dimer ribbon diagram.
FIGURE 11.
FIGURE 11.
Multiple sequence alignment of TIR domains. A, the amino acid sequences of TcpB-TIR (residues 119–250) and PdTIR (residues 167–299), and the TIR domains from the uropathogenic E. coli TIR domain-containing protein (TcpC-TIR) (residues 171–307), the S. enterica serovar enteritidis TIR domain-containing protein (TlpA-TIR) (residues 160–293), and S. aureus TIR domain-containing protein (Sa-TIR) (residues 143–280). B, the TIR domain from MAL (residues 86–256), MyD88 (residues 161–296), TLR4 (residues 587–752), TLR2 (residues 641–784), TLR1 (637–786), and TLR10 (residues 634–811) were aligned using MUSCLE (61). The alignment was formatted using ESPript (62). The positions of secondary structure elements of TcpB-TIR are shown above the alignment. Conserved residues are shown in white on red background. Similar residues are shown in red and surrounded by red boxes. Key residues in TcpB-TIR dimer contact are shown in blue.
FIGURE 12.
FIGURE 12.
The dimer interface is important for TcpB function. HEK293-TLR4-MD2 cells (8 × 10⁴ cells/well) were co-transfected for 24 h with 200 ng of plasmids encoding V5-TcpB (wild type), V5-TcpB mutants (D217A, Y216A, K213A, K213E, S235A, N233A, L236A, W211A, R220A, R220E, and G158A), or empty vector pGL-2B (EV) with NF-κB luciferase reporter gene (100 ng) and phRL-TK reporter gene (20 ng) using Lipofectamine 2000. The final amount of DNA (460 ng) was kept constant in all transfections by adding empty vector pGL-2B. Cells were stimulated with 100 ng/ml LPS for 8 h and lysed with Promega lysis buffer. The data (average of n = 3) are displayed as luciferase activity, relative to Renilla luciferase activity. Error bars represent S.E. of three independent experiments. ****, p < 0.0001 compared with empty vector plus LPS.
FIGURE 13.
FIGURE 13.
Schematic modeling of the TcpB inhibition of TLR4 signaling. Oval shapes represent TcpB (orange), TLR4 (blue), MAL (yellow), and MyD88 (green). The model emphasizes the key findings from our study and is a simplified diagram of the signaling system. For example, the exact domains involved in the interactions between these proteins have not yet been clearly defined, and thus the model does not show specific domain interactions. A, a simplified representation of the TLR4 signaling pathway, showing the activation and dimerization of TLR4 creates a platform to form a complex with MAL and MyD88. B, the presence of TcpB causes suppression of the TLR4 signaling pathway, by forming a complex with TLR4, MAL, and MyD88.

References

    1. Kawai T., Akira S. (2010) The role of pattern-recognition receptors in innate immunity. Update on Toll-like receptors. Nat. Immunol. 11, 373–384 - PubMed
    1. Ve T., Gay N. J., Mansell A., Kobe B., Kellie S. (2012) Adaptors in Toll-like receptor signaling and their potential as therapeutic targets. Curr. Drug Targets 13, 1360–1374 - PubMed
    1. Atluri V. L., Xavier M. N., de Jong M. F., den Hartigh A. B., Tsolis R. M. (2011) Interactions of the human pathogenic Brucella species with their hosts. Annu. Rev. Microbiol. 65, 523–541 - PubMed
    1. Pappas G., Papadimitriou P., Akritidis N., Christou L., Tsianos E. V. (2006) The new global map of human brucellosis. Lancet Infect. Dis. 6, 91–99 - PubMed
    1. Elde N. C., Malik H. S. (2009) The evolutionary conundrum of pathogen mimicry. Nat. Rev. Microbiol. 7, 787–797 - PubMed

Publication types

MeSH terms

Substances