Review
. 2013 Dec;24 Suppl 10(Suppl 10):x7-15.
doi: 10.1093/annonc/mdt462.

Ovarian cancer: genomic analysis

Affiliations
Review

Ovarian cancer: genomic analysis

W Wei et al. Ann Oncol. 2013 Dec.

Abstract

Objectives: Despite improvements in the management of ovarian cancer patients over the last 30 years, there has been only a minimal improvement in overall survival. While targeted therapeutic approaches for the treatment of cancer have evolved, major challenges in ovarian cancer research persist, including the identification of predictive biomarkers with clinical relevance, so that empirical drug selection can be avoided. In this article, we review published genomic analysis studies including data generated in our laboratory and how they have been incorporated into modern clinical trials in a rational and effective way.

Methods: Multiple published genomic analysis studies were collected for review and discussion with emphasis on their potential clinical applicability.

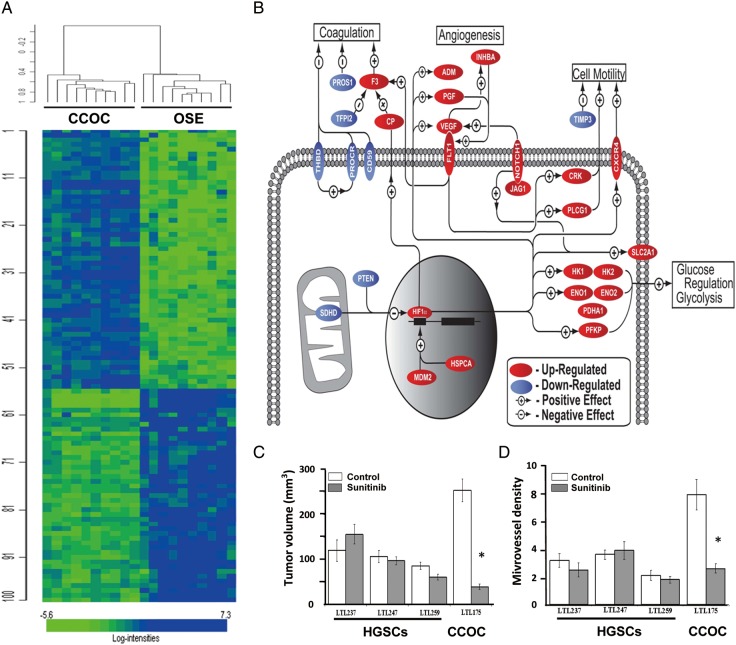
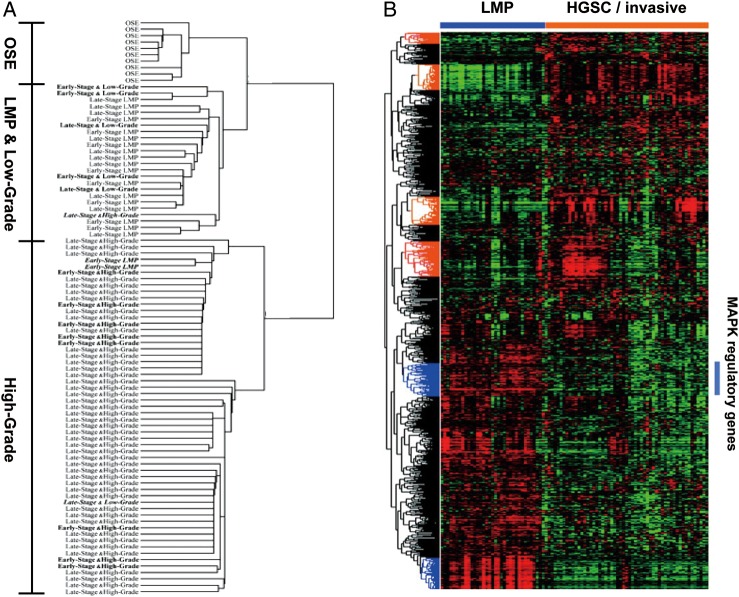
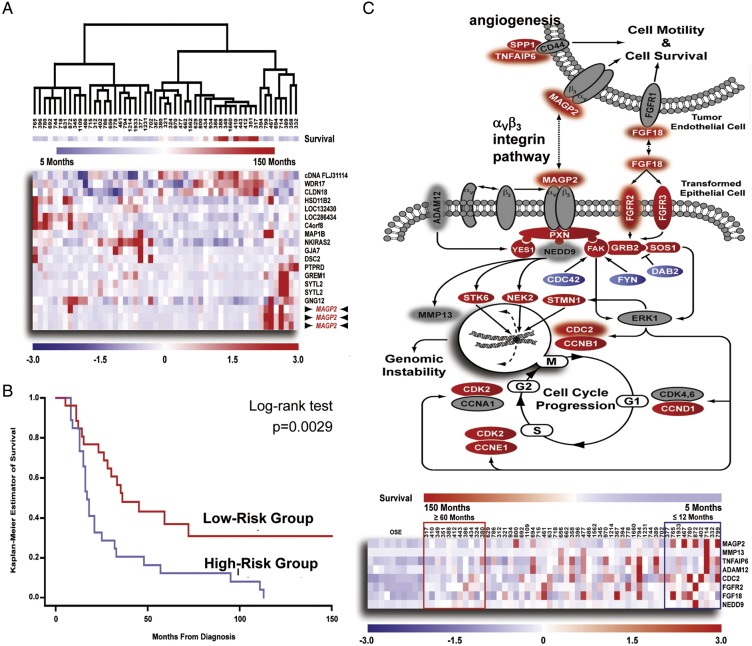
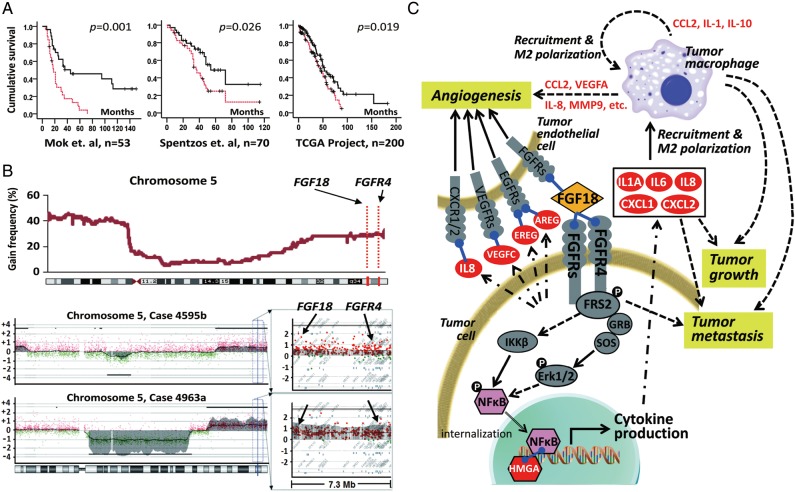
Results: Genomic analysis has been shown to be a powerful tool to identify dysregulated genes, aberrantly activated pathways and to uncover uniqueness of subclasses of ovarian tumors. The application of this technology has provided a solid molecular basis for different clinical behaviors associated with tumor histology and grade. Genomic signatures have been obtained to predict clinical end points for patients with cancer, including response rates, progression-free survival, and overall survival. In addition, genomic analysis has provided opportunities to identify biomarkers, which either result in a modification of existing clinical management or to stratification of patients to novel therapeutic approaches designed as clinical trials.

Conclusions: Genomic analyses have accelerated the identification of relevant biomarkers and extended our understanding of the molecular biology of ovarian cancer. This in turn, will hopefully lead to a paradigm shift from empirical, uniform treatment to a more rational, personalized treatment of ovarian cancers. However, validation of potential biomarkers on both the statistical and biological levels is needed to confirm they are of clinical relevance, in order to increase the likelihood that the desired outcome can be predicted and achieved.

Keywords: cancer; clinical trials; genomics; ovarian.


Figures

Figure 1.
Figure 1.
Whole-genome expression profiling of clear-cell ovarian carcinomas. (A) Graphic representation of whole-genome expression profiling of the specimens from clear-cell ovarian carcinoma (CCOC) and ovarian surface epithelium (OSE). (B) Pathway analysis of differentially regulated genes identified by the transcriptome profiling. Genes included in the analysis were required to have a fold change ≥1.5 (over OSE). Multiple probe sets were averaged for each gene. (C) Effect of a 2-week treatment with sunitinib on growth of subrenal capsule xenografts in NOD-SCID mice (6 mice/group; 2 grafts per kidney) of transplantable high-grade serous (HGSC) and clear-cell ovarian carcinoma (CCOC) tissue lines derived from patients' cancers. Growth of the xenografts is expressed as tumor volume. Data are presented as means ± SEM. (D) Effect of sunitinib on microvessel density of subrenal capsule xenografts in NOD-SCID mice of serous (HGSC) and clear-cell (CCOC) ovarian carcinoma tissue lines. Data are presented as the average number of blood vessels per 400× microscopic field ± SEM. *P < 0.01 Adapted from Stany et al. [21].
Figure 2.
Figure 2.
Distinct expression profiles between low-grade/low malignant potential (LMP) and high-grade serous ovarian tumors. (A and B) Unsupervised hierarchical clustering from two independent studies Bonome et al. [17] (A) and Anglesio et al. [47] (B) are presented. The second study further suggests a gene expression matrix consisting of MAPK pathway regulated genes (as defined by ontology classification tools DAVID and Panther, highlighted by a bar) in LMP serous ovarian tumors.
Figure 3.
Figure 3.
Identification of a prognostic gene expression signature correlating with survival in microdissected advanced-stage HGSCs. (A) Hierarchical clustering of 53 advanced-stage HGSCs using expression values for genes possessing a Cox score >10. (B) Kaplan–Meier analysis of the predictor demonstrated a significant difference in survival time (P = 0.0029). (C) Assessment of putative signaling events contributing to patient survival through pathway analysis. Differentially regulated genes identified in the 53 microdissected serous tumors, when compared with 10 normal OSE brushings were labeled with white fonts. Genes predictive of poor prognosis is cycled with halo. A heat map is shown below to demonstrate association between survival signature genes identified in the pathway and overall patient survival. Adapted from Mok et al. [58].
Figure 4.
Figure 4.
Identification of FGF18 as a prognostic gene in high-grade advanced-stage papillary serous ovarian tumors. (A) Kaplan–Meier analysis of FGF18 expression in patients in three independent sets of serous ovarian cancer samples. Analysis was done by median cut with the P-value of log-rank test presented for each set. Solid lines: samples with low FGF18, broken lines: samples with high FGF18, ‘+’: censored samples. (B) CGH analysis of 72 serous ovarian tumors showed an increased DNA copy number for chromosome segment 5q31.3–5q35.3 in ∼25% of the samples (upper panel). Chromosome 5 profiles of two representative tumors with the detail of a 7.3-Mb locus (chromosome 5 distance: 170.3–177.6 Mb) containing FGF18 and FGFR4 (lower panel). Copy number was presented by log2 − 1 (value of 0 mean diploid). FGF18 and FGFR4 are amplified to at least four copies among the 5615 probes in the x-axis. (C) The effect of FGF18 on the pathogenesis of serous ovarian cancer. Gene expression profiling was carried out to compare the transcriptome of ovarian cancer cell lines with ectopic overexpression of FGF18 or RFP as control. Genes directly induced by FGF18 are labeled in white font. Arrows indicate potential interactions that contribute to FGF18-mediated ovarian tumorigenesis. Adapted from Wei et al.

References

    1. Lozano R, Naghavi M, Foreman K, et al. Global and regional mortality from 235 causes of death for 20 age groups in 1990 and 2010: a systematic analysis for the Global Burden of Disease Study 2010. Lancet. 2012;380:2095–2128. - PMC - PubMed
    1. Chornokur G, Amankwah EK, Schildkraut JM, et al. Global ovarian cancer health disparities. Gynecol Oncol. 2013;129:258–264. - PMC - PubMed
    1. Colombo N, Peiretti M, Castiglione M. Non-epithelial ovarian cancer: ESMO clinical recommendations for diagnosis, treatment and follow-up. Ann Oncol. 2009;20(Suppl 4):24–26. - PubMed
    1. del Carmen MG, Birrer M, Schorge JO. Carcinosarcoma of the ovary: a review of the literature. Gynecol Oncol. 2012;125:271–277. - PubMed
    1. Bristow RE, Tomacruz RS, Armstrong DK, et al. Survival effect of maximal cytoreductive surgery for advanced ovarian carcinoma during the platinum era: a meta-analysis. J Clin Oncol. 2002;20:1248–1259. - PubMed

Publication types

Substances