. 2014 Feb;24(2):212-26.
doi: 10.1101/gr.152132.112. Epub 2013 Nov 21.

Transcriptome characterization by RNA sequencing identifies a major molecular and clinical subdivision in chronic lymphocytic leukemia

Affiliations

Transcriptome characterization by RNA sequencing identifies a major molecular and clinical subdivision in chronic lymphocytic leukemia

Pedro G Ferreira et al. Genome Res. 2014 Feb.

Abstract

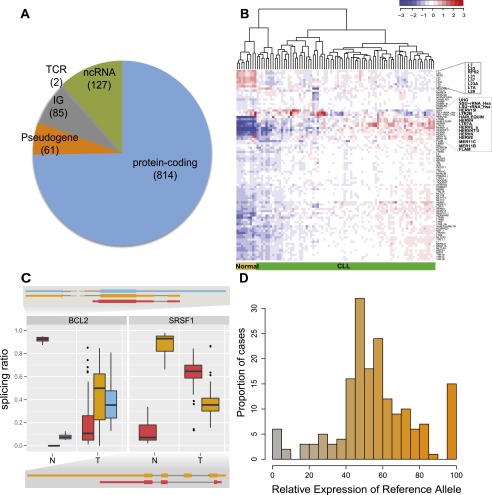
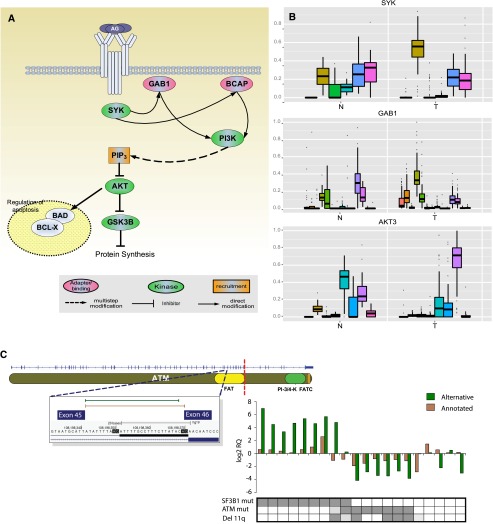
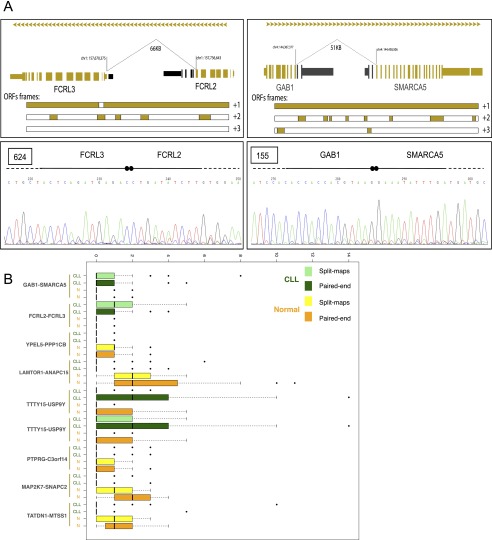
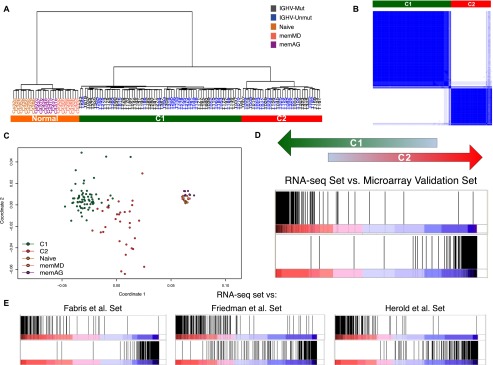
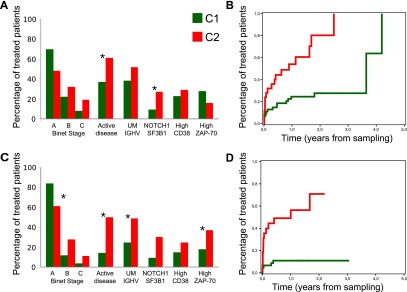
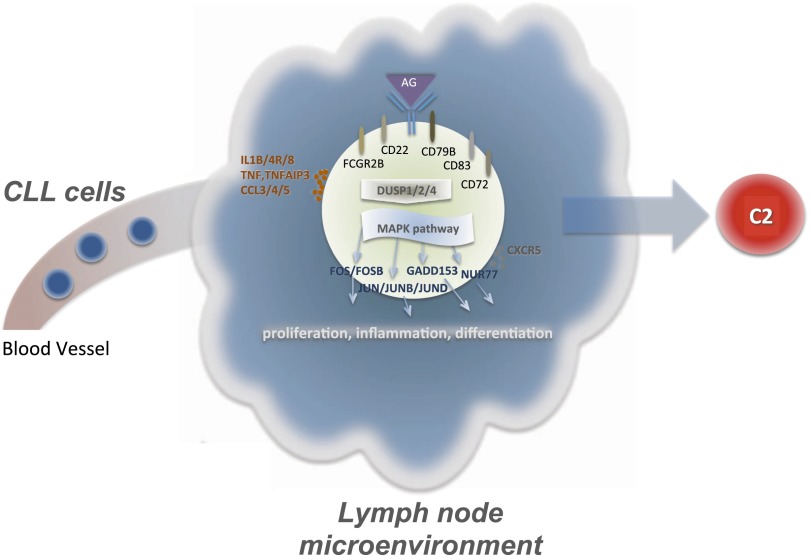
Chronic lymphocytic leukemia (CLL) has heterogeneous clinical and biological behavior. Whole-genome and -exome sequencing has contributed to the characterization of the mutational spectrum of the disease, but the underlying transcriptional profile is still poorly understood. We have performed deep RNA sequencing in different subpopulations of normal B-lymphocytes and CLL cells from a cohort of 98 patients, and characterized the CLL transcriptional landscape with unprecedented resolution. We detected thousands of transcriptional elements differentially expressed between the CLL and normal B cells, including protein-coding genes, noncoding RNAs, and pseudogenes. Transposable elements are globally derepressed in CLL cells. In addition, two thousand genes-most of which are not differentially expressed-exhibit CLL-specific splicing patterns. Genes involved in metabolic pathways showed higher expression in CLL, while genes related to spliceosome, proteasome, and ribosome were among the most down-regulated in CLL. Clustering of the CLL samples according to RNA-seq derived gene expression levels unveiled two robust molecular subgroups, C1 and C2. C1/C2 subgroups and the mutational status of the immunoglobulin heavy variable (IGHV) region were the only independent variables in predicting time to treatment in a multivariate analysis with main clinico-biological features. This subdivision was validated in an independent cohort of patients monitored through DNA microarrays. Further analysis shows that B-cell receptor (BCR) activation in the microenvironment of the lymph node may be at the origin of the C1/C2 differences.


Figures

Figure 1.
Figure 1.
CLL transcriptional landscape. (A) Distribution of differentially expressed genes between tumor and normal samples according to their coding potential. (B) Normalized expression of transposable elements (TEs). Blue indicates low expression and red high expression, with some of the TEs differentially expressed highlighted. (C) Genes with condition-specific splicing ratios. Two of the genes with the most significant differences in the relative abundance of alternatively spliced isoforms between tumor and normal samples are shown. The boxplots correspond to the distribution of the relative abundances for each transcript (represented with a specific color) in the normal (left, N) and tumor (right, T) populations. The exonic structure of each transcript is represented using the same color scheme. (D) Allele-specific expression of somatic mutations. The relative expression of the reference allele, as derived from RNA-seq reads, was binned, and the number of cases in each bin plotted. The color gradient reflects the relative expression of the two alleles (the value that labels the bin in the x-axis).
Figure 2.
Figure 2.
Splicing changes in the BCR pathway between normal (N) and tumor (T) samples. (A) Partial view of the BCR signaling pathway with representation of genes with significant changes in alternative splicing. (B) Distribution of alternative splicing ratios between tumor and normal samples for three example genes in the BCR pathway highlighted in A. (C) ATM splicing in SF3B1-mutated samples. (Top left) Location of CLL-specific novel splice junction in the ATM gene. The novel 3′ splice site extends 20 bp upstream into the intron. Red dashed line indicates the truncation of the C-terminal end of ATM caused by the frame shift introduced by the novel splice site. (Bottom right) Expression levels of the putative and annotated junctions analyzed by qPCR. The log2 scale of the relative gene expression is represented for cases with SF3B1 mutation (dark gray), cases with ATM mutation and/or 11q deletion (dark gray), and cases without these genetic alterations. Light gray indicates unknown status.
Figure 3.
Figure 3.
Chimeric junctions between FCRL2–FCRL3 and GAB1–SMARCA5. (A) Schematic representation of the chimeric genes, associated ORFs, and junction sequences. (Top) Black boxes represent exons skipped by the chimeric junction. ORFs in the three possible frames are indicated in yellow. (Bottom) Sanger sequencing for the junction part of each chimera. The number in the square corresponds to the CLL sequenced sample. (B) Number of split-mapped (single reads split and mapped independently) and paired-end (two single reads from both ends of the same fragment) reads supporting the two chimeras and six previously described cases. TTTY15–USP9Y is reported twice because of the presence of two distinct fusion points. We should note that, although split-mapped and paired-end reads are shown separately, each chimera is supported by a combination of both.
Figure 4.
Figure 4.
Major transcriptional CLL subgroups. (A) Clustering of CLL and normal samples. Dendrogram obtained by hierarchical clustering of CLL and normal samples. (B) Consensus cluster. The matrix shows a clear and robust separation between CLL samples in C1 and C2. Dark blue regions indicate cluster partitions for samples that always cluster together (high consensus) and white indicate partitions with low consensus. (C) Multidimensional scaling of CLL and normal samples according to gene expression. (D) Enrichment score plot by GSEA comparing the RNA-seq based clustering with the clustering of an independent set of 124 samples, profiled with expression arrays. The plot compares the ranking correlation of the list of genes from the two clustering solutions. The vertical dark lines indicate where the genes in one list appear in the other ranked list of genes. An accumulation at the extremes indicates an agreement between the two lists. (E) Enrichment score plot by GSEA comparing the clustering in the RNA-seq and the previously published data sets. The three previously published data sets (Fabris et al. 2008; Friedman et al. 2009; Herold et al. 2011) contained 60, 40, and 106 samples, respectively.
Figure 5.
Figure 5.
Clinical behavior of the C1 (green) and C2 (red) subgroups. (A) Distribution of clinico-biological features in the RNA-seq profiled patients. (B) Time to treatment in the RNA-seq profiled patients at Binet stages A and B. (C) Distribution of clinico-biological features in the microarray profiled patients from the independent validation series. (D) Time to treatment in the microarray-profiled patients from the independent validation series at Binet stages A and B.
Figure 6.
Figure 6.
Interaction of CLL cells and the lymph node microenvironment. Stimulation of the BCR complex and other receptor and cell surface genes (CD79B, CD22, CD83, FCRG2B) leads to downstream changes in regulation. Affected genes such as those of the DUSP family, involved in the regulation of the MAPK pathway, may explain transcriptional differences observed for this pathway. Up-regulation of transcriptional regulators, like FOS and JUN, may trigger proliferation and inflammation processes that could be at the origin of C2 cells. Other genes involved in cell–cell signaling are also up-regulated in C2.

References

    1. Anczukow O, Rosenberg AZ, Akerman M, Das S, Zhan L, Karni R, Muthuswamy SK, Krainer AR 2012. The splicing factor SRSF1 regulates apoptosis and proliferation to promote mammary epithelial cell transformation. Nat Struct Mol Biol 19: 220–228 - PMC - PubMed
    1. Antonov AV 2011. BioProfiling.de: Analytical web portal for high-throughput cell biology. Nucleic Acids Res 39: W323–W327 - PMC - PubMed
    1. Berger MF, Levin JZ, Vijayendran K, Sivachenko A, Adiconis X, Maguire J, Johnson LA, Robinson J, Verhaak RG, Sougnez C, et al. 2010. Integrative analysis of the melanoma transcriptome. Genome Res 20: 413–427 - PMC - PubMed
    1. Buchner M, Fuchs S, Prinz G, Pfeifer D, Bartholome K, Burger M, Chevalier N, Vallat L, Timmer J, Gribben JG, et al. 2009. Spleen tyrosine kinase is overexpressed and represents a potential therapeutic target in chronic lymphocytic leukemia. Cancer Res 69: 5424–5432 - PubMed
    1. Burger JA, Gandhi V 2009. The lymphatic tissue microenvironments in chronic lymphocytic leukemia: In vitro models and the significance of CD40-CD154 interactions. Blood 114: 2560–2561, author reply 2561–2562 - PMC - PubMed

Publication types

Substances