. 2013 Nov 8:7:102.
doi: 10.3389/fncom.2013.00102. eCollection 2013.

Biophysical basis of the sound analog membrane potential that underlies coincidence detection in the barn owl

Affiliations

Biophysical basis of the sound analog membrane potential that underlies coincidence detection in the barn owl

Go Ashida et al. Front Comput Neurosci. .

Abstract

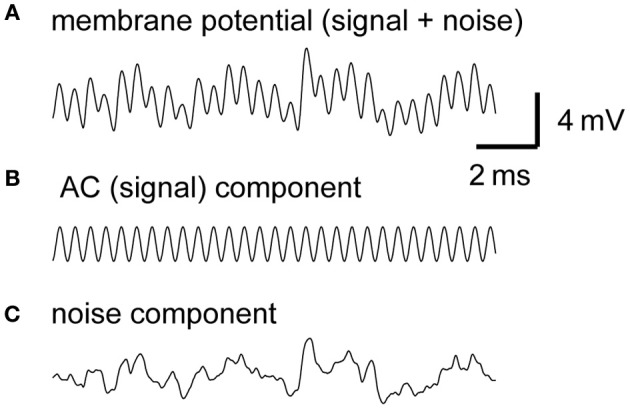
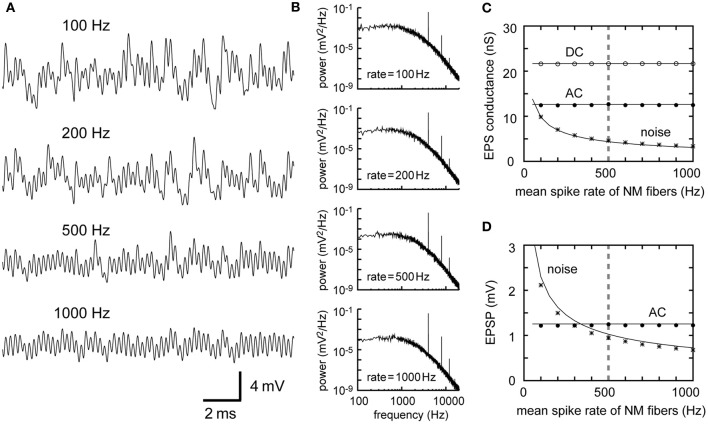
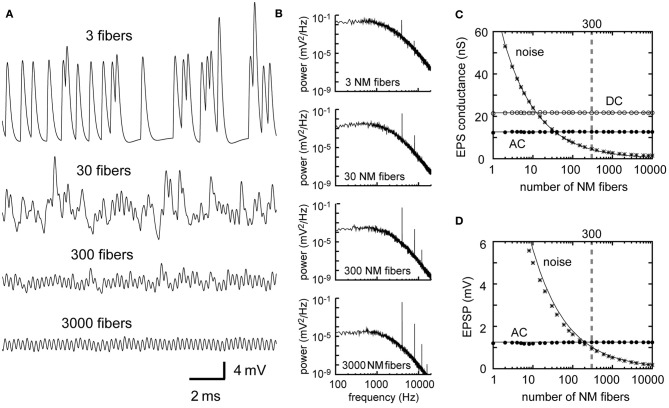
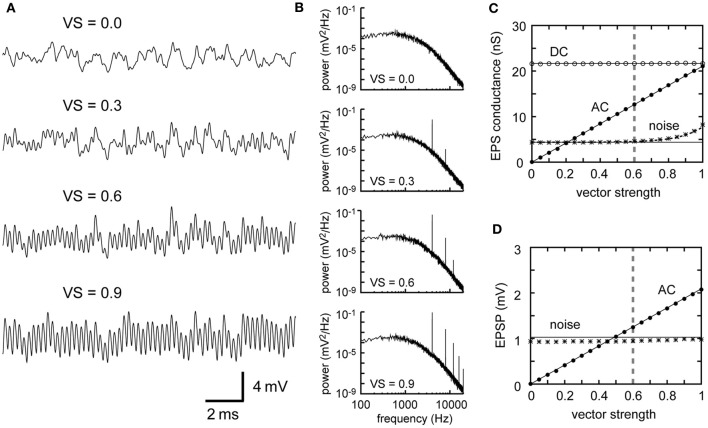
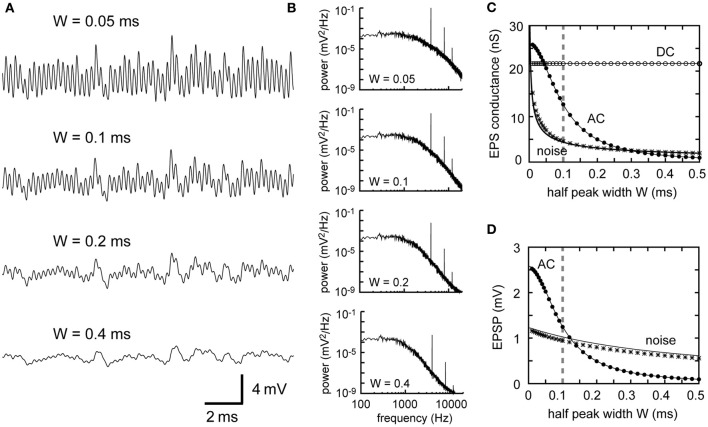
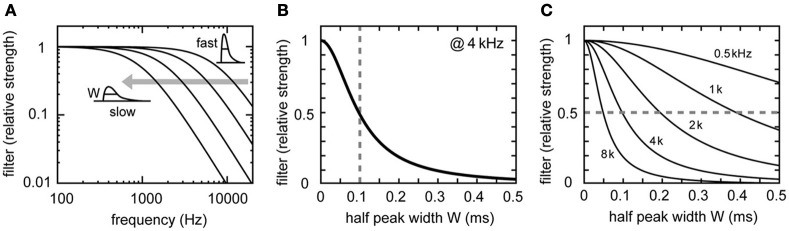
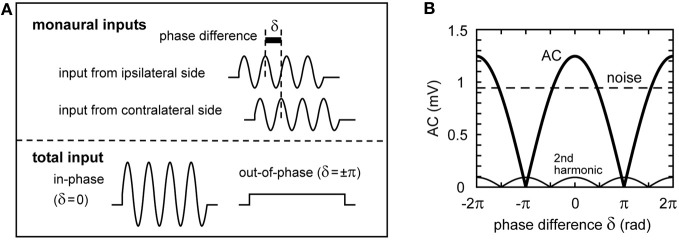
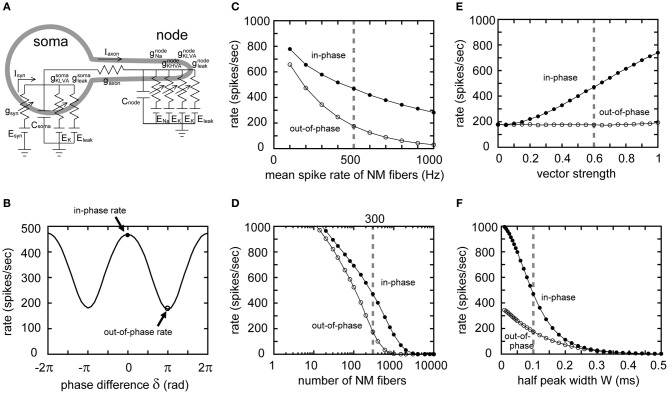
Interaural time difference (ITD), or the difference in timing of a sound wave arriving at the two ears, is a fundamental cue for sound localization. A wide variety of animals have specialized neural circuits dedicated to the computation of ITDs. In the avian auditory brainstem, ITDs are encoded as the spike rates in the coincidence detector neurons of the nucleus laminaris (NL). NL neurons compare the binaural phase-locked inputs from the axons of ipsi- and contralateral nucleus magnocellularis (NM) neurons. Intracellular recordings from the barn owl's NL in vivo showed that tonal stimuli induce oscillations in the membrane potential. Since this oscillatory potential resembled the stimulus sound waveform, it was named the sound analog potential (Funabiki et al., 2011). Previous modeling studies suggested that a convergence of phase-locked spikes from NM leads to an oscillatory membrane potential in NL, but how presynaptic, synaptic, and postsynaptic factors affect the formation of the sound analog potential remains to be investigated. In the accompanying paper, we derive analytical relations between these parameters and the signal and noise components of the oscillation. In this paper, we focus on the effects of the number of presynaptic NM fibers, the mean firing rate of these fibers, their average degree of phase-locking, and the synaptic time scale. Theoretical analyses and numerical simulations show that, provided the total synaptic input is kept constant, changes in the number and spike rate of NM fibers alter the ITD-independent noise whereas the degree of phase-locking is linearly converted to the ITD-dependent signal component of the sound analog potential. The synaptic time constant affects the signal more prominently than the noise, making faster synaptic input more suitable for effective ITD computation.

Keywords: auditory brainstem; oscillation; owl; periodic signals; phase-locking; sound localization.


Figures

Figure 1
Figure 1
Example traces of the model membrane potential with default parameters. The default parameters used for this example are summarized in Table 1. (A) Simulated membrane potential oscillating at 4 kHz. (B) AC component of the simulated membrane potential. Amplitude = 1.25 mV (see Materials and Methods for definition). Average peak-to-peak height = 2.50 mV. (C) Noise component of the simulated membrane potential. Amplitude (measured by the time-averaged standard deviation) is 1.03 mV in this example.
Figure 2
Figure 2
Dependence of synaptic input in NL on the firing rate of presynaptic NM fibers. (A) Simulated traces of the model membrane potential. The number above each trace shows the output spike rate of NM fibers. The traces become less noisy as the NM rate increases. (B) Power spectral densities of the four traces shown in (A). Low frequency noise components decrease with increasing NM rates, while peaks at the input frequency and higher harmonics remain unchanged. (C) Dependence of the DC, AC, and noise amplitudes of the simulated synaptic input on the mean spike rate of NM fibers. (D) Dependence of the AC and noise amplitudes of the simulated membrane potential on the mean spike rate of NM fibers. Solid lines in (C) and (D) are obtained from analytical calculations (Equations 1–5). Vertical broken gray lines in (C) and (D) show the default parameter (500 Hz) used in our simulations.
Figure 3
Figure 3
Dependence of the synaptic input in NL on the number of presynaptic NM fibers. (A) Simulated traces of the model membrane potential. The number above each trace shows the numbers of NM fibers. The traces become less noisy as the number of NM fibers increases. (B) Power spectral densities of the four traces shown in (A). Low frequency noise components decrease with increasing numbers of NM fibers, while peaks at the input frequency and higher harmonics remain unchanged. Although the trace with 3 NM fibers (A, top) looks considerably different from the other three traces, its AC component (B, top) has the same amplitude as the other three. (C) Dependence of the DC, AC, and noise amplitudes of the simulated synaptic input on the number of NM fibers. (D) Dependence of the AC and noise amplitudes of the simulated membrane potential on the number of NM fibers. Solid lines in (C) and (D) are obtained from analytical calculations (Equations 1–5). Vertical broken gray lines in (C) and (D) show the default parameter (300 fibers) used in our simulations.
Figure 4
Figure 4
Dependence of the synaptic input in NL on the degree of phase-locking of presynaptic NM fibers. (A) Simulated traces of the model membrane potential. The number above each trace shows the vector strength of NM fibers. The traces show larger oscillations (higher AC amplitudes) as VS increases. (B) Power spectral densities of the four traces shown in (A). Peaks at the input frequency (4 kHz) and higher harmonics increase with increasing VS, while the other frequency components remain unchanged. (C) Dependence of the DC, AC, and noise amplitudes of the simulated synaptic input on VS. (D) Dependence of the AC and noise amplitudes of the simulated membrane potential on VS. Solid lines in (C) and (D) are obtained from analytical calculation without higher harmonics included. The dotted black line in (C) is obtained from analytical calculations with the second harmonic included. Vertical broken gray lines in (C) and (D) show the default parameter (VS = 0.6) used in our simulations.
Figure 5
Figure 5
Dependence of synaptic input in NL on the synaptic time scale. (A) Simulated traces of the model membrane potential. The number above each trace shows the half peak widths W of the unitary synaptic input modeled by an alpha function (see Table 1). The traces show larger oscillations (higher AC amplitudes) as W decreases. (B) Power spectral densities of the four traces shown in (A). Higher frequency components decrease with increasing W. (C) Dependence of the DC, AC, and noise amplitudes of the simulated synaptic input on the synaptic time scale W. (D) Dependence of the AC and noise amplitudes of the simulated membrane potential on the synaptic time scale W. Solid lines in (C) and (D) are obtained from analytical calculations (Equations 1–5). Vertical broken gray lines in (C) and (D) show the default parameter (W = 0.1) used in our simulations.
Figure 6
Figure 6
Frequency properties of the synaptic filter. (A) Fourier transform |Fα(f)| of the synaptic filter α(t) (see Table 1). Normalized curves with W = 0.05, 0.10, 0.20, and 0.40 are shown. The synaptic filter becomes more likely to reduce high frequency components as the synaptic time scale W becomes smaller. (B) Synaptic filter at 4 kHz showing non-linear dependence on W. The vertical broken gray line in (B) shows the default parameter (W = 0.1) used in our simulations. (C) Comparison of synaptic filters at different sound stimulus frequencies fs (0.5, 1, 2, 4, and 8 kHz). Filter strength exceeds 0.5 (broken gray line), if and only if the inequality W < k/(2πfs) is satisfied. Note that this critical W-value is dependent on the frequency.
Figure 7
Figure 7
Schematic representation of the binaural synaptic input to the NL neuron. (A) Summation of the synaptic input from ipsi- and contralateral NM fibers. The oscillation amplitude of the total synaptic input in NL is maximal when the two inputs arrive perfectly in-phase, while it becomes smaller when the two inputs are out of phase. For clarity, onset effects, higher harmonics, and noise components are not included in this schematic figure. (B) The oscillation amplitude of the total NM inputs. The amplitude of the AC component changes periodically with the phase difference δ of the two inputs according to the Equation: Amp(δ) = |A cos(δ/2)|, with A being the maximum AC amplitude (Ashida et al., 2007). The second harmonic also changes periodically with δ, but its period is half of that of the main signal (AC).
Figure 8
Figure 8
Reponses of the two-compartment NL model to 4 kHz input. (A) Two-compartment NL neuron model, with a soma and a node interconnected by an axonal conductance. The somatic compartment has the same amount of leak and low-voltage-activated potassium (KLVA) conductances as the single compartment model. In addition to the leak and KLVA, the nodal compartment has Na and high-voltage-activated potassium (KHVA) conductances to generate spikes. (B) Spike rate of the model neuron plotted against the phase difference δ between ipsi- and contralateral model NM inputs. We define the spike rate with δ = 0 as the “in-phase rate,” and δ = ±π as the “out-of-phase rate.” In-phase and out-of-phase rates are plotted against the mean spike rate of NM fibers (C), the total number of NM fibers (D), the degree of phase-locking of the NM fibers (E), and the half peak width W of the unitary synaptic input conductance (F). Vertical broken gray lines in (C–F) show the default parameters (λ0 = 500 Hz, M = 300 fibers, r = 0.6, W = 0.1 ms) used in our simulations.

References

    1. Agmon-Snir H., Carr C. E., Rinzel J. (1998). The role of dendrites in auditory coincidence detection. Nature 393, 268–272 10.1038/30505 - DOI - PubMed
    1. Anastassiou C. A., Perin R., Markram H., Koch C. (2011). Ephaptic coupling of cortical neurons. Nat. Neurosci. 14, 217–223 10.1038/nn.2727 - DOI - PubMed
    1. Ashida G., Abe K., Funabiki K., Konishi M. (2007). Passive soma facilitates submillisecond coincidence detection in the owl's auditory system. J. Neurophysiol. 97, 2267–2282 10.1152/jn.00399.2006 - DOI - PubMed
    1. Ashida G., Carr C. E. (2011). Sound localization: Jeffress and beyond. Curr. Opin. Neurobiol. 21, 745–751 10.1016/j.conb.2011.05.008 - DOI - PMC - PubMed
    1. Ashida G., Funabiki K., Carr C. E. (2013). Theoretical foundations of the sound analogue membrane potential that underlies coincidence detection in the barn owl. Front. Comput. Neurosci. 7: 151 10.3389/fncom.2013.00151 - DOI - PMC - PubMed

LinkOut - more resources