. 2013 Nov 8:7:151.
doi: 10.3389/fncom.2013.00151. eCollection 2013.

Theoretical foundations of the sound analog membrane potential that underlies coincidence detection in the barn owl

Affiliations

Theoretical foundations of the sound analog membrane potential that underlies coincidence detection in the barn owl

Go Ashida et al. Front Comput Neurosci. .

Abstract

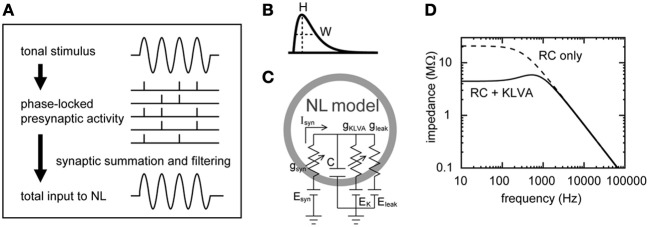
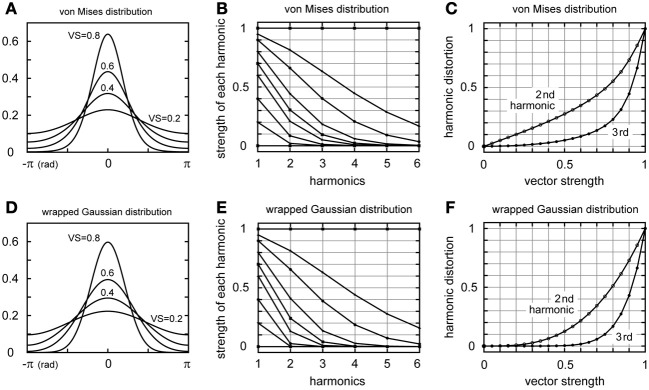
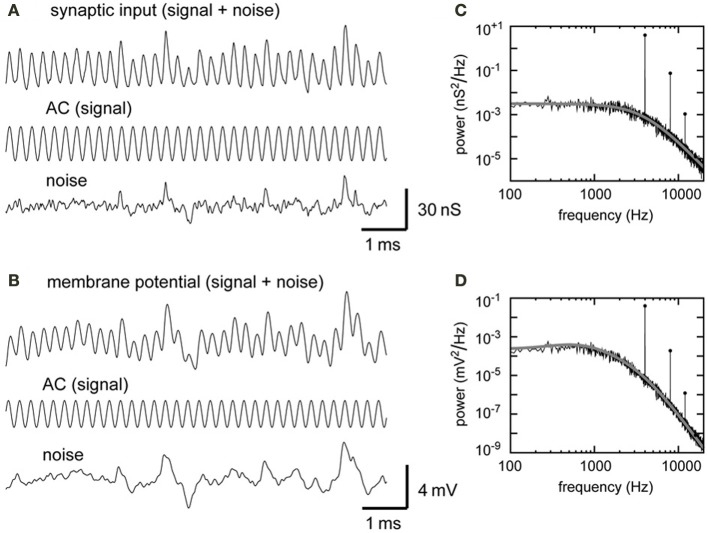
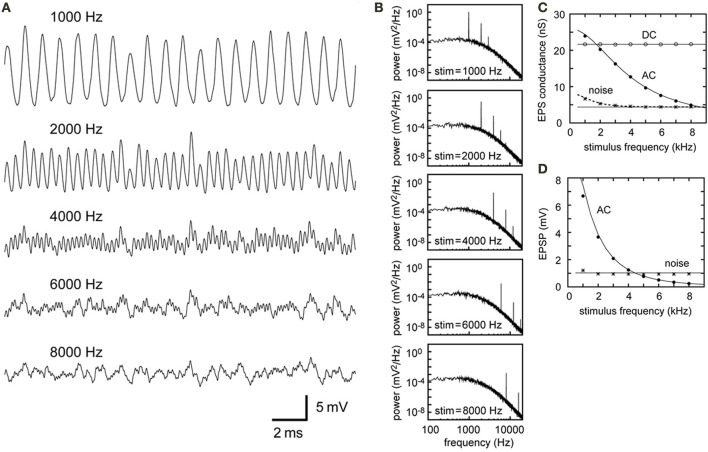
A wide variety of neurons encode temporal information via phase-locked spikes. In the avian auditory brainstem, neurons in the cochlear nucleus magnocellularis (NM) send phase-locked synaptic inputs to coincidence detector neurons in the nucleus laminaris (NL) that mediate sound localization. Previous modeling studies suggested that converging phase-locked synaptic inputs may give rise to a periodic oscillation in the membrane potential of their target neuron. Recent physiological recordings in vivo revealed that owl NL neurons changed their spike rates almost linearly with the amplitude of this oscillatory potential. The oscillatory potential was termed the sound analog potential, because of its resemblance to the waveform of the stimulus tone. The amplitude of the sound analog potential recorded in NL varied systematically with the interaural time difference (ITD), which is one of the most important cues for sound localization. In order to investigate the mechanisms underlying ITD computation in the NM-NL circuit, we provide detailed theoretical descriptions of how phase-locked inputs form oscillating membrane potentials. We derive analytical expressions that relate presynaptic, synaptic, and postsynaptic factors to the signal and noise components of the oscillation in both the synaptic conductance and the membrane potential. Numerical simulations demonstrate the validity of the theoretical formulations for the entire frequency ranges tested (1-8 kHz) and potential effects of higher harmonics on NL neurons with low best frequencies (<2 kHz).

Keywords: auditory brainstem; oscillation; owl; periodic signals; phase-locking; sound localization.


Figures

Figure 1
Figure 1
Schematic drawings of the synaptic input and the membrane response of the NL neuron model. (A) Formation of the oscillatory synaptic input. Tonal stimuli induce phase-locked spiking in NM fibers that converge on an NL neuron, creating a periodic oscillation in the synaptic input to NL. For clarity, higher harmonics and noise components are not included in this schematic drawing. (B) Alpha-function as the model unitary synaptic input. The half peak width W determines the speed of rise and decay, while H is the peak height of the curve (see text for equations). (C) Single compartment NL neuron model (Funabiki et al., 2011). Leak and low-voltage-activated potassium (KLVA) conductances are included in the membrane. (D) Linear membrane impedance of the model neuron. Introduction of the KLVA conductance greatly reduces membrane impedance below 1–2 kHz.
Figure 2
Figure 2
Periodic distributions and higher harmonics. (A) The von Mises distribution. Curves with VS = 0.2, 0.4, 0.6, and 0.8 are shown (see below for the values of the concentration parameter κ). (B) Strengths of the first harmonic (fundamental frequency) and higher harmonics of the von Mises distribution. Each curve shows the strength of the first harmonic (VS) and corresponding higher harmonics. (C) Second and third harmonic distortion of the von Mises distribution. (D) The wrapped Gaussian distribution. Curves with VS = 0.2, 0.4, 0.6, and 0.8 are shown (see below for the values of the dispersion σ. (E) Strengths of the first harmonic (fundamental frequency) and higher harmonics of the wrapped Gaussian distribution. Each curve shows the strength of the first harmonic (VS) and corresponding higher harmonics. (F) Second and third harmonic distortion of the wrapped Gaussian distribution. In (B,E), nine curves (VS = 0, κ = 0, σ = ∞; VS = 0.2, κ = 0.408, σ = 1.794; VS = 0.4, κ = 0.874, σ = 1.353; VS = 0.6, κ = 1.516, σ = 1.011; VS = 0.7, κ = 2.014, σ = 0.845; VS = 0.8, κ = 2.871, σ = 0.668; VS = 0.9, κ = 5.305, σ = 0.459; VS = 0.95, κ = 10.27, σ = 0.320; VS = 1; κ = ∞, σ = 0) are drawn to show the decaying patterns of harmonics.
Figure 3
Figure 3
Model synaptic input and model NL membrane potential. (A) Simulated synaptic input conductance. The compound synaptic input, its signal component, and its noise component are shown. (B) Simulated membrane potential with its signal and noise components. The synaptic input shown in (A) (top trace) was injected to the model membrane (shown in Figure 1C). The AC components (center traces in A,B) were obtained from cosine fitting. The noise component (bottom traces in A,B) was obtained by subtracting AC (center traces in A,B) from the total input (top traces in A,B) (see Materials and Methods for detail). Input frequency = 4 kHz. (C) PSD of the input trace shown in (A). A sharp peak appears at the stimulus frequency (4 kHz) and smaller peaks appear at higher harmonics. (D) PSD of the potential trace shown in (B). Gray lines and filled circles in (C,D) show analytically predicted values.
Figure 4
Figure 4
Simulations of the synaptic input in NL with different stimulus frequencies. All the parameters except the stimulus frequency are fixed (see Table 2). (A) Simulated traces of the model membrane potential. Stimulus frequencies are from 1000 to 8000 Hz, which correspond to the owl's best hearing frequencies. (B) PSDs of the five traces shown in (A). Positions and heights of the peaks at the input frequency and higher harmonics depend on the stimulus frequency, while the other frequency components remain unchanged. (C) Dependence of the DC, AC, and noise amplitudes of the simulated synaptic input on the stimulus frequency. (D) Dependence of the AC and noise components of the simulated membrane potential on the stimulus frequency. The solid lines in (C,D) are obtained from analytical calculations without higher harmonics included. The dotted black line in (C) is obtained from analytical calculations with the second harmonic included (i.e., NG=NG2+L22; see Equations 7, 8). The effect of higher harmonics is clear in the noise component of the synaptic input for stimulus frequencies below 2 kHz (shown in C), whereas it is not prominent in the membrane potential (shown in D).

References

    1. Abramowitz M., Stegun I. A. (eds.). (1972). Handbook of Mathematical Functions with Formulas, Graphs, and Mathematical Tables (tenth printing). New York, NY: Dover
    1. Anderson D. J. (1973). Quantitative model for the effects of stimulus frequency upon synchronization of auditory nerve discharges. J. Acoust. Soc. Am. 54, 361–364 10.1121/1.1913585 - DOI - PubMed
    1. Ashida G., Abe K., Funabiki K., Konishi M. (2007). Passive soma facilitates submillisecond coincidence detection in the owl's auditory system. J. Neurophysiol. 97, 2267–2282 10.1152/jn.00399.2006 - DOI - PubMed
    1. Ashida G., Carr C. E. (2011). Sound localization: jeffress and beyond. Curr. Opin. Neurobiol. 21, 745–751 10.1016/j.conb.2011.05.008 - DOI - PMC - PubMed
    1. Ashida G., Funabiki K., Carr C. E. (2013). Biophysical basis of the sound analogue membrane potential that underlies coincidence detection in the barn owl. Front. Comput. Neurosci. 7:102 10.3389/fncom.2013.00102 - DOI - PMC - PubMed

LinkOut - more resources