. 2013 Nov 12;8(11):e79973.
doi: 10.1371/journal.pone.0079973. eCollection 2013.

Structural variation-associated expression changes are paralleled by chromatin architecture modifications

Affiliations

Structural variation-associated expression changes are paralleled by chromatin architecture modifications

Nele Gheldof et al. PLoS One. .

Abstract

Copy number variants (CNVs) influence the expression of genes that map not only within the rearrangement, but also to its flanks. To assess the possible mechanism(s) underlying this "neighboring effect", we compared intrachromosomal interactions and histone modifications in cell lines of patients affected by genomic disorders and control individuals. Using chromosome conformation capture (4C-seq), we observed that a set of genes flanking the Williams-Beuren Syndrome critical region (WBSCR) were often looping together. The newly identified interacting genes include AUTS2, mutations of which are associated with autism and intellectual disabilities. Deletion of the WBSCR disrupts the expression of this group of flanking genes, as well as long-range interactions between them and the rearranged interval. We also pinpointed concomitant changes in histone modifications between samples. We conclude that large genomic rearrangements can lead to chromatin conformation changes that extend far away from the structural variant, thereby possibly modulating expression globally and modifying the phenotype.

Geo series accession number: GSE33784, GSE33867.


Conflict of interest statement

Competing Interests: The authors have declared that no competing interests exist.

Figures

Figure 1
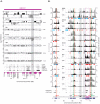
Figure 1. Extensive chromatin interactions of seven genes flanking the WBSCR on human chromosome 7 (HSA7) in cells from a healthy control individual.
(A) Windowed and normalized 4C signal of each of the seven viewpoints along the entire HSA7. The black ticks below each graph show the location of the Bricks (Blocks of Regulators In Chromosomal Kontext). The gene density across HSA7, as well as the windowed profiles of H4K20me1 and H3K27me3 marks in the same cell line are shown below. Some examples of strong correlation of gene-dense regions and high density of H4K20me1 marks with highly interacting regions are highlighted in blue. The mapping of the assessed genes/viewpoints and of the WBSCR is indicated at the bottom. The red box specifies the close-up shown in panel B. (B) Close-up of the windowed 4C signal of the seven viewpoints around the WBSCR for the region indicated with a red box on HSA7 (top panel). The windowed 4C signal is shown in grey, while the profile corrected 4C signal (after removal of the highly interacting neighboring background signal) is overlaid in black. The position of all genes are displayed at the bottom, and the mapping of the assessed viewpoints is highlighted by red and green arrows indicating if the corresponding genes are down- or upregulated in cells from WBS patients, respectively. Black arrows underscore the mapping of the viewpoint that is not modified in gene expression (ZNF107) and the newly identified interacting partners AUTS2 and CALN1. The location of the WBSCR is indicated by a purple horizontal bar. A close-up of interactions within this WBSCR is provided in Supplementary Figure S4.
Figure 2
Figure 2. Modification of short-range interactions in WBS compared to control cells.
(A) Close-up of the log2-fold interaction changes in WBS versus Ctrl within the WBSCR. The black line indicates the median of the changes within the WBSCR, which is also displayed at the right of each graph. The dashed lines show the 95% confidence interval. The positions of all genes are displayed at the bottom with purple arrows. The area highlighted in grey pinpoints the higher interactions in Ctrl cells between the KCTD7 viewpoint and the region around the CLIP2 and GTF2IRD1 genes. The black ticks below show the location of the five marks of regulatory regions in GM12878 cells (as found in the ENCODE data), including CTCF binding sites, DHSs, FAIRE sites, H3K27ac and H3K4me1 and binding sites, with one overlapping mark highlighted with a red asterisk. (B) Windowed 4C signal of each of the seven viewpoints in both Ctrl and WBS cells around the WBSCR (see the legend of Figure 1B for details about the structures outlined). The log2-fold change of the windowed 4C data in WBS over control cells was calculated, and the resulting positive or negative Bricks are indicated below each viewpoint graphs, by blue or red bars, respectively. The significant changes in histone marks (as defined by SICER) are plotted below by ticks.

References

    1. Redon R, Ishikawa S, Fitch KR, Feuk L, Perry GH, et al. (2006) Global variation in copy number in the human genome. Nature 444: 444–454. - PMC - PubMed
    1. Graubert TA, Cahan P, Edwin D, Selzer RR, Richmond TA, et al. (2007) A high-resolution map of segmental DNA copy number variation in the mouse genome. PLoS Genet 3: e3. - PMC - PubMed
    1. Cutler G, Marshall LA, Chin N, Baribault H, Kassner PD (2007) Significant gene content variation characterizes the genomes of inbred mouse strains. Genome Res 17: 1743–1754. - PMC - PubMed
    1. She X, Cheng Z, Zollner S, Church DM, Eichler EE (2008) Mouse segmental duplication and copy number variation. Nat Genet 40: 909–914. - PMC - PubMed
    1. Henrichsen CN, Vinckenbosch N, Zollner S, Chaignat E, Pradervand S, et al. (2009) Segmental copy number variation shapes tissue transcriptomes. Nat Genet 41: 424–429. - PubMed

Publication types

Associated data