. 2014 Apr;176(1):37-48.
doi: 10.1111/cei.12243.

Ex-vivo tolerogenic F4/80⁺ antigen-presenting cells (APC) induce efferent CD8⁺ regulatory T cell-dependent suppression of experimental autoimmune uveitis

Affiliations

Ex-vivo tolerogenic F4/80⁺ antigen-presenting cells (APC) induce efferent CD8⁺ regulatory T cell-dependent suppression of experimental autoimmune uveitis

S-M Hsu et al. Clin Exp Immunol. 2014 Apr.

Abstract

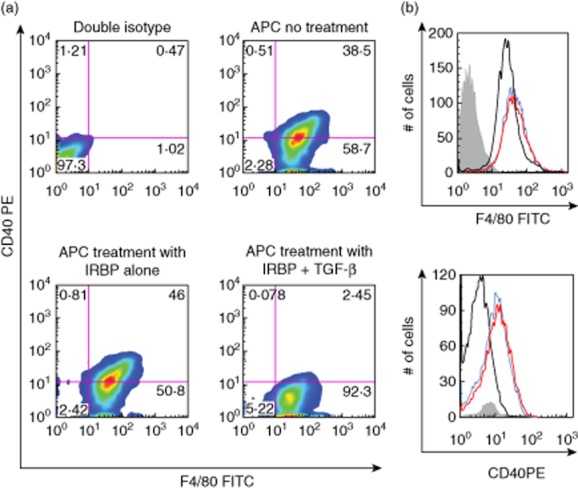
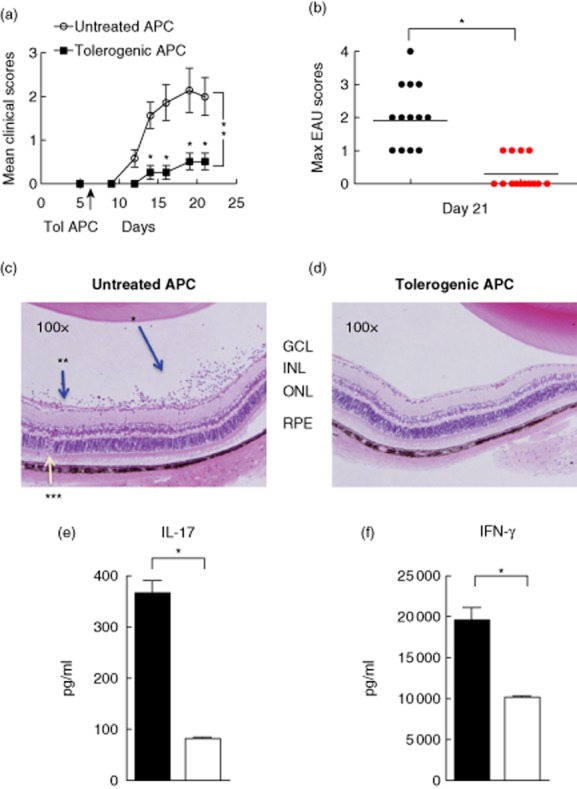
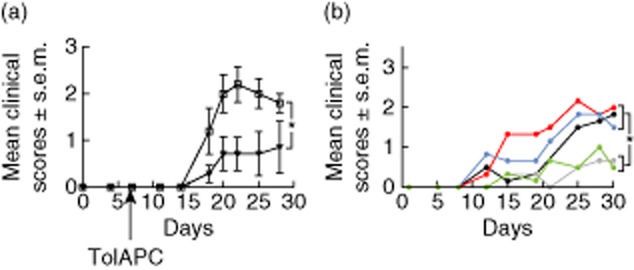
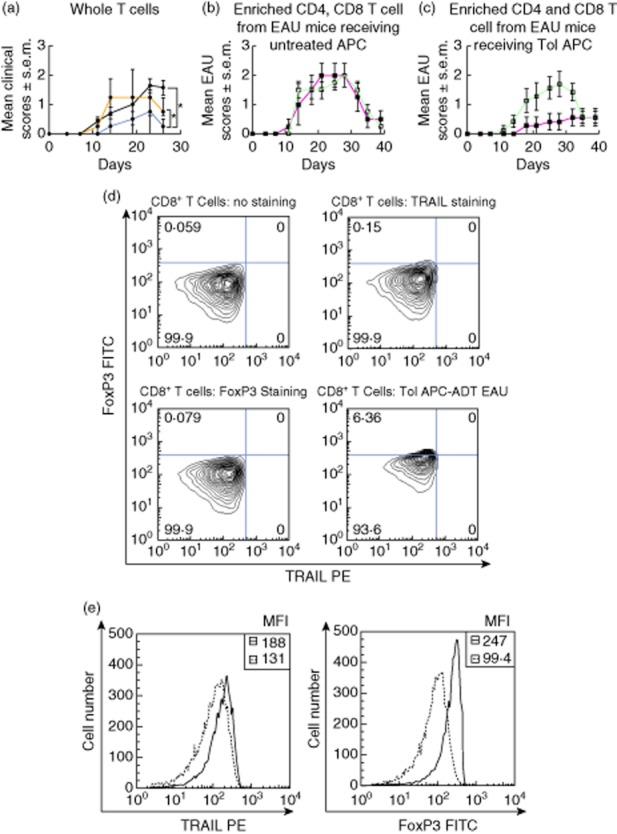
It is known that inoculation of antigen into the anterior chamber (a.c.) of a mouse eye induces a.c.-associated immune deviation (ACAID), which is mediated in part by antigen-specific local and peripheral tolerance to the inciting antigen. ACAID can also be induced in vivo by intravenous (i.v.) inoculation of ex-vivo-generated tolerogenic antigen-presenting cells (TolAPC). The purpose of this study was to test if in-vitro-generated retinal antigen-pulsed TolAPC suppressed established experimental autoimmune uveitis (EAU). Retinal antigen-pulsed TolAPC were injected i.v. into mice 7 days post-induction of EAU. We observed that retinal antigen-pulsed TolAPC suppressed the incidence and severity of the clinical expression of EAU and reduced the expression of associated inflammatory cytokines. Moreover, extract of whole retina efficiently replaced interphotoreceptor retinoid-binding protein (IRBP) in the preparation of TolAPC used to induce tolerance in EAU mice. Finally, the suppression of EAU could be transferred to a new set of EAU mice with CD8⁺ but not with CD4⁺ regulatory T cells (T(reg)). Retinal antigen-pulsed TolAPC suppressed ongoing EAU by inducing CD8⁺ T(reg) cells that, in turn, suppressed the effector activity of the IRBP-specific T cells and altered the clinical symptoms of autoimmune inflammation in the eye. The ability to use retinal extract for the antigen raises the possibility that retinal extract could be used to produce autologous TolAPC and then used as therapy in human uveitis.

Keywords: ACAID; CD8+ Treg; EAU; autoimmunity; tolerogenic APC.


Figures

Figure 1
Figure 1
Flow analysis of CD40 expression. (a) Antigen-presenting cells (APC) were treated with transforming growth factor (TGF)-β2 and interphotoreceptor retinoid-binding protein (IRBP) overnight to produce tolerogenic antigen-presenting cells (TolAPC). F4/80 is plotted on the abscissa and CD40 on the ordinate. (b) Upper histograph of APC stained with F4/80 after various treatments. Lower histograph of APC gated for F4/80 fluorescein isothiocyanate (FITC)-positive cells and analysed for CD40 phycoerythrin (PE). TolAPC (black); APC without treatment (blue); APC pulsed with IRBP (red). Shaded graph represents the isotype control. Representative of two experiments.
Figure 2
Figure 2
Effect of tolerogenic antigen-presenting cells (TolAPC) on clinical course of experimental autoimmune uveitis (EAU). (a) Average clinical score over time of EAU in mice with and without TolAPC treatment. EAU was induced by adoptive transfer of interphotoreceptor retinoid-binding protein (IRBP)-sensitized enriched T cells into C57BL/6 mice. A week later, TolAPC (red n = 14) or untreated antigen-presenting cells (APC) (black n = 14) were injected intravenously (i.v., 106 cells/mouse) into EAU mice. Data shown are the mean clinical score (ordinate) of each experiment group over time (abscissa), and are the sum of two independent experiments. Comparison of (the course of the clinical symptoms) untreated EAU mice versus TolAPC-treated mice shows a significant difference (P ≤ 0·05) and is indicated. (b) Scatterplot shows peak scores on day 21 of individual EAU mice were given TolAPC (red) or not (black). The peak clinical scores over time of TolAPC-treated EAU mice are significantly lower than the peak scores over time of the untreated EAU mice. *Indicates a significant difference (P ≤ 0·05). (c,d) Photomicrographs of haematoxylin and eosin (H&E)-stained retinal tissue. Representative photomicrographs paraffin-fixed H&E stained slides of the retina of (c) EAU mice that received untreated APC (*leucocytes in vitreous cavity; **swelling; ***retinal fold) and (d) EAU mice that received TolAPC days post-initiation of EAU. Retinal pigment epithelium (RPE), outer nuclear layer (ONL), inner nuclear layer (INL), ganglion cell layer (GCL). (e,f) Enzyme-linked immunosorbent assay (ELISA) analysis of inflammatory cytokines in spleen cells harvested at day 23 of EAU mice that received either TolAPC or spleen cells were restimulated with antigen with serum-free media for 48 h prior to collecting the supernatants for analyses. Bar graphs showing (e) interleukin (IL)-17 and (f) interferon (IFN)-γ production. Spleen cells (from three separate mice) were harvested from APC-(solid bar) or TolAPC-treated EAU mice (three per group) co-cultured with antigen (IRBP 50 ug/ml) (open bar). Supernatants from duplicate cultures were harvested 48 h after restimulation with IRBP for ELISA analysis. An asterisk (*) indicates a significant difference (P ≤ 0·05).
Figure 3
Figure 3
Effect of retinal antigen-pulsed tolerogenic antigen-presenting cells (TolAPC) on clinical course of experimental autoimmune uveitis (EAU) induced with interphotoreceptor retinoid-binding protein (IRBP). (a) Comparison of clinical scores of EAU mice treated with retinal extract-pulsed TolAPC (filled triangles, n = 7) or EAU mice not treated (open squares, n = 7). Data are shown as mean clinical EAU score ± standard error of the mean (s.e.m.) (ordinate) over time (abscissa). The retinal extract-pulsed TolAPC-treated mice show a significant (P ≤ 0·05) decrease in EAU clinical score over time compared to scores of EAU in untreated mice. (b) Antigen specificity of TolAPC-induced suppression. The EAU mice were treated with each type of TolAPC, 7 days post-induction of EAU (Materials and methods). Line graph of response of EAU mice to TolAPC pulsed with indicated antigens. The transferred antigen-presenting cells (APC) were not pulsed with antigen (black line, n = 15) or were treated with transforming growth factor (TGF)-β and pulsed with corneal extract (red line, n = 7), myelin basic protein (MBP) (blue line, n = 6), IRBP(1–20) (grey line, n = 14) or retinal extract (green line, n = 16). Data shown are mean clinical score (ordinate) over time (abscissa). An asterisk (*) indicates a significant difference between the areas under the curves. Statistics were performed using Prism software (Materials and methods).
Figure 4
Figure 4
The regulatory effects of CD4+ or CD8+ T cells from tolerogenic antigen-presenting cells (TolAPC)-treated experimental autoimmune uveitis (EAU) mice. The line graph represents progression of mean clinical scores of EAU over time. The ordinate = mean EAU clinical scores; abscissa = days post-induction of EAU. Whole T cells, CD4+ or CD8+ T cells were collected from the spleens of mice that were either TolAPC or antigen-presenting cells (APC). Enriched T cells were collected at the peak of clinical symptoms and transferred to a new group of EAU mice to test for their suppressor function. (a) Clinical course of EAU in mice receiving no T cells (n = 14, black line); clinical course of EAU in mice receiving T cells harvested from the EAU mice were injected with APC (n = 4, orange line); clinical course of EAU in mice receiving T cells harvested from the EAU mice that were injected with TolAPC (n = 4, blue line). (b) Effects on EAU of mice receiving enriched T cells (CD8+ T red line; CD4+ T green line) harvested from the EAU mice were injected with APC. (c) Effects on EAU of mice receiving enriched T cells (CD8+ T red line; CD4+ T green line) from EAU mice that were injected with TolAPC (n = 7 per group). Each recipient mouse received one donor equivalent. *Significant difference (P ≤ 0·05) in overall severity of the disease over time between two indicated experimental groups. (d) Representative flow cytometry analysis of CD8+ T cells handled in the same manner as the CD8+ T cells in (c). Upper left block shows resting CD8+ T cells with no staining; upper right block are resting CD8+ T cells stained with tumour necrosis factor (TNF)-related apoptosis-inducing ligand (TRAIL) antibody only; lower left block shows resting CD8+ T cells stained with forkhead box protein 3 (FoxP3) antibody only; and lower right shows the CD8+ T cells harvested from the TolAPC-treated mice used in (c) (red line) stained from FoxP3 FITC (ordinate) and TRAIL phycoerythrin (PE) (abscissa) (e) Mean fluorescence intensity (MFI) analyses of CD8+ T cells from TolAPC-treated EAU mice (solid line) compared to staining on CD8+ T cells from EAU mice. The abscissa represents the intensity of the fluorescence for the indicated antibody; the ordinate shows the cell number; insert box gives the actual reading for the MFI. Dashed line (—) APC-treated EAU CD8+ T cells; solid line (—) TolAPC-treated EAU CD8+ T cells. The left block shows that there is a little or no increase in fluorescence intensity staining for TRAIL in the two types of CD8+ T cells compared. The right block shows a major shift in staining intensity for the MFI of FoxP3 staining and CD8+ T cells from the TolAPC-treated EAU mice.
Figure 5
Figure 5
Effect of CD8+ tumour necrosis factor (TNF)-related apoptosis-inducing ligand (TRAIL) cells on suppression. (a) Flow cytometry gate used for analysis. Spleen cells were cultured with antigen-presenting cells (APC) treated with transforming growth factor (TGF)-β2 and interphotoreceptor retinoid-binding protein (IRBP). Seven days later the CD8+ T cells were enriched by magnetic beads and single-stained for CD8 (top panel). Lower panel: an aliquot of enriched CD8+ T cells was stained with TRAIL phycoerythrin (PE) (abscissa) and forkhead box protein 3 (FoxP3) (fluorescein isothiocyanate (FITC) (ordinate). (b) Local adoptive transfer assay using CD8+TRAIL T cells. The experiment was performed twice with similar results. *Significant difference (P ≤ 0·05).

References

    1. Gregerson DS, Heuss ND, Lehmann U, McPherson SW. Peripheral induction of tolerance by retinal antigen expression. J Immunol. 2009;183:814–822. - PMC - PubMed
    1. Streilein JW. Ocular immune privilege: therapeutic opportunities from an experiment of nature. Nat Rev Immunol. 2003;3:878–889. - PubMed
    1. Taylor AW. Neuropeptides, aqueous humor, and ocular immune privilege. In: Troger J, Kieslbach G, Bechrakis N, editors. Neuropeptides in the eye. Kerala: Research Signpost; 2009. pp. 79–91.
    1. Hori J, Wang M, Miyashita M, et al. B7-H1-induced apoptosis as a mechanism of immune privilege of corneal allografts. J Immunol. 2006;177:5928–5935. - PubMed
    1. Ferguson TA, Griffith TS. The role of Fas ligand and TNF-related apoptosis-inducing ligand (TRAIL) in the ocular immune response. Chem Immunol Allergy. 2007;92:140–154. - PubMed

Publication types

MeSH terms