. 2013 Nov 23:14:340.
doi: 10.1186/1471-2105-14-340.

Reverse causal reasoning: applying qualitative causal knowledge to the interpretation of high-throughput data

Affiliations

Reverse causal reasoning: applying qualitative causal knowledge to the interpretation of high-throughput data

Natalie L Catlett et al. BMC Bioinformatics. .

Abstract

Background: Gene expression profiling and other genome-scale measurement technologies provide comprehensive information about molecular changes resulting from a chemical or genetic perturbation, or disease state. A critical challenge is the development of methods to interpret these large-scale data sets to identify specific biological mechanisms that can provide experimentally verifiable hypotheses and lead to the understanding of disease and drug action.

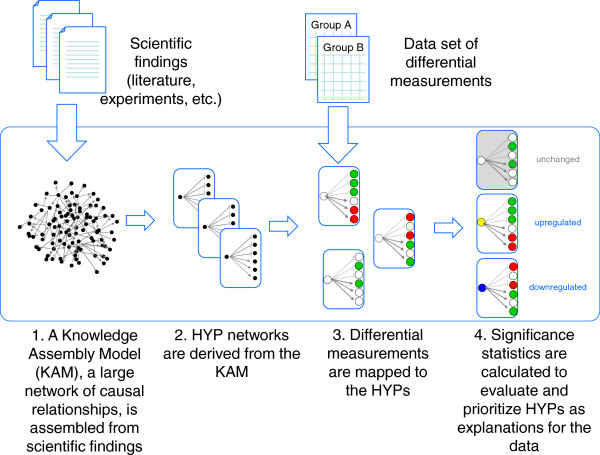
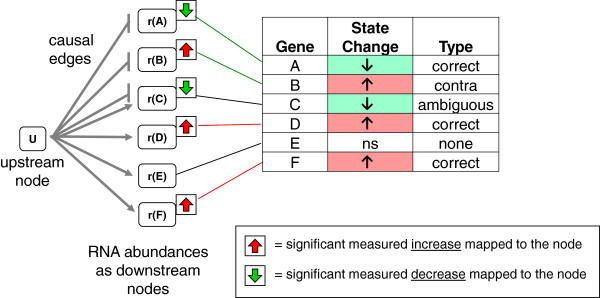
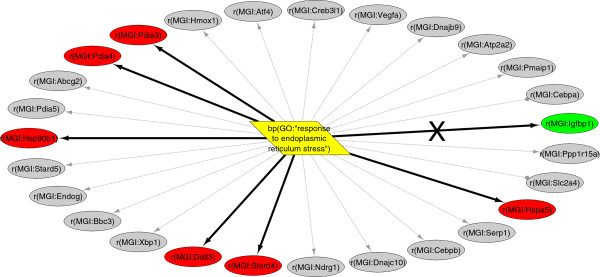
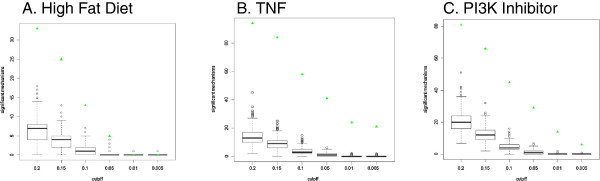
Results: We present a detailed description of Reverse Causal Reasoning (RCR), a reverse engineering methodology to infer mechanistic hypotheses from molecular profiling data. This methodology requires prior knowledge in the form of small networks that causally link a key upstream controller node representing a biological mechanism to downstream measurable quantities. These small directed networks are generated from a knowledge base of literature-curated qualitative biological cause-and-effect relationships expressed as a network. The small mechanism networks are evaluated as hypotheses to explain observed differential measurements. We provide a simple implementation of this methodology, Whistle, specifically geared towards the analysis of gene expression data and using prior knowledge expressed in Biological Expression Language (BEL). We present the Whistle analyses for three transcriptomic data sets using a publically available knowledge base. The mechanisms inferred by Whistle are consistent with the expected biology for each data set.

Conclusions: Reverse Causal Reasoning yields mechanistic insights to the interpretation of gene expression profiling data that are distinct from and complementary to the results of analyses using ontology or pathway gene sets. This reverse engineering algorithm provides an evidence-driven approach to the development of models of disease, drug action, and drug toxicity.


Figures

Figure 1
Figure 1
Overview of whistle. Whistle evaluates molecular mechanisms as potential explanations for gene expression data by mapping measurements and differentially expressed genes to a directed network of prior scientific knowledge.
Figure 2
Figure 2
Mapping of differential measurements to a HYP network. A HYP consists of an upstream node, U, and downstream nodes, designated r(A) – r(F), that represent abundances of RNAs measured in the experiment. This example network has six measured downstream nodes (possible), five of which map to significantly increased or decreased genes (observed). Node E is not significantly changed in expression. Three nodes, r(A), r(D), and r(F), support increased U (correct). One node, r(B), supports decreased U (contra). One node, r(C), is connected to U by both causal increase and causal decrease edges (ambiguous). On the basis of the mapped measurements, the direction “increased” is assigned to U.
Figure 3
Figure 3
Scored HYP example. The HYP with the upstream node bp(GO:“response to endoplasmic reticulum stress”), scored for the E-MEXP-1755 high fat diet data set. This network contains 27 measured RNA abundance nodes (possible), represented as ovals coloured by differential expression (red – significantly increased, green – significantly decreased, grey – no significant change). A total of seven differentially expressed RNAs mapped to the network (observed), including six supporting increased mechanism activity (correct) and one supporting decreased activity (contra, marked with an ‘X’ on the edge).
Figure 4
Figure 4
Numbers of significant HYPs at different richness and concordance thresholds in randomized data sets. Boxplot showing the number of HYPs (mechanisms) meeting the specified richness and concordance threshold across 1,000 randomized data sets. The number of significant HYPs at each threshold for the matching real data is plotted for comparison in green. (A) High Fat Diet, (B) TNF treatment, (C) PI3K inhibitor.

References

    1. Huang DW, Sherman BT, Lempicki RA. Bioinformatics enrichment tools: paths toward the comprehensive functional analysis of large gene lists. Nucleic Acids Res. 2009;37:1–13. doi: 10.1093/nar/gkn923. - DOI - PMC - PubMed
    1. Wu MC, Lin X. Prior biological knowledge-based approaches for the analysis of genome-wide expression profiles using gene sets and pathways. Stat Methods Med Res. 2009;18:577–593. doi: 10.1177/0962280209351925. - DOI - PMC - PubMed
    1. Khatri P, Sirota M, Butte AJ. Ten years of pathway analysis: current approaches and outstanding challenges. PLoS Comput Biol. 2012;8:e1002375. doi: 10.1371/journal.pcbi.1002375. - DOI - PMC - PubMed
    1. Kanehisa M, Goto S, Furumichi M, Tanabe M, Hirakawa M. KEGG for representation and analysis of molecular networks involving diseases and drugs. Nucleic Acids Res. 2010;38:D355–D360. doi: 10.1093/nar/gkp896. - DOI - PMC - PubMed
    1. Ashburner M, Ball CA, Blake JA, Botstein D, Butler H, Cherry JM, Davis AP, Dolinski K, Dwight SS, Eppig JT, Harris MA, Hill DP, Issel-Tarver L, Kasarskis A, Lewis S, Matese JC, Richardson JE, Ringwald M, Rubin GM, Sherlock G. Gene ontology: tool for the unification of biology. The gene ontology consortium. Nat Genet. 2000;25:25–29. doi: 10.1038/75556. - DOI - PMC - PubMed

Publication types

LinkOut - more resources