. 2013 Nov 20;80(4):887-99.
doi: 10.1016/j.neuron.2013.08.029.

Single-neuron correlates of atypical face processing in autism

Affiliations

Single-neuron correlates of atypical face processing in autism

Ueli Rutishauser et al. Neuron. .

Abstract

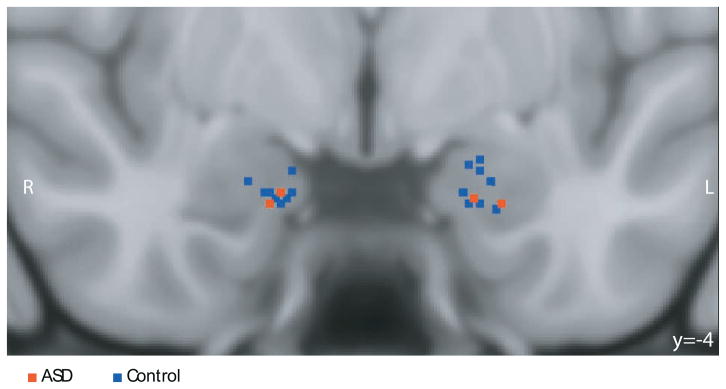
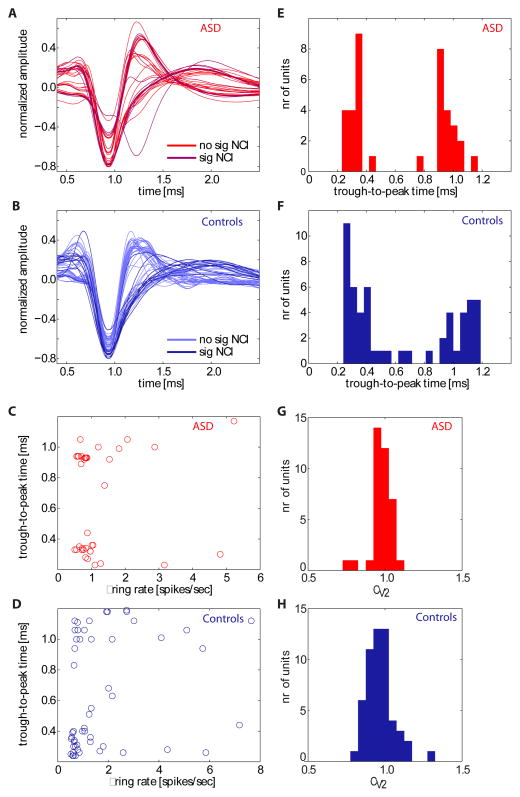
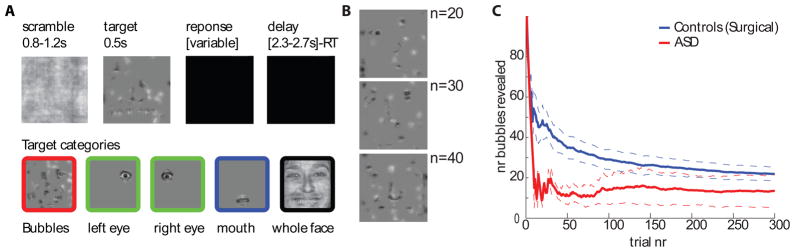
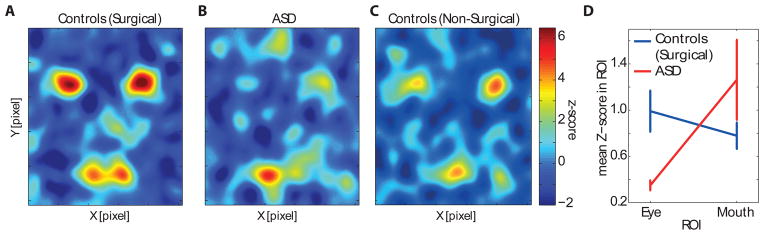
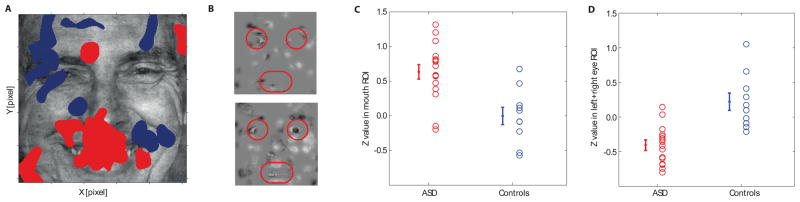
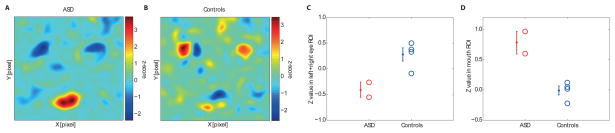
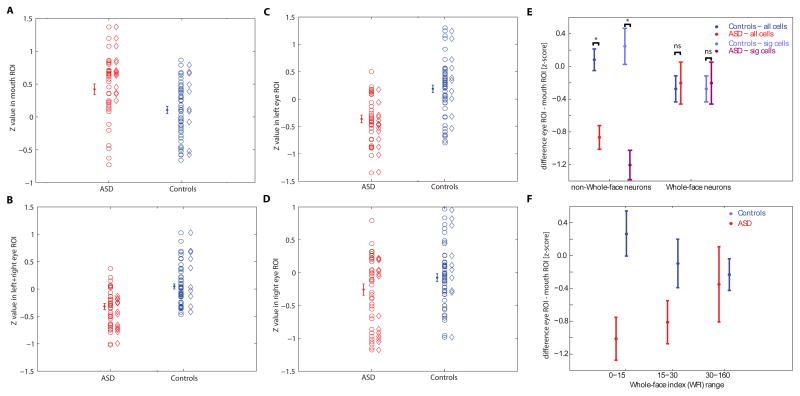
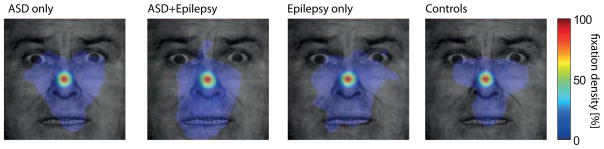
People with autism spectrum disorder (ASD) show abnormal processing of faces. A range of morphometric, histological, and neuroimaging studies suggest the hypothesis that this abnormality may be linked to the amygdala. We recorded data from single neurons within the amygdalae of two rare neurosurgical patients with ASD. While basic electrophysiological response parameters were normal, there were specific and striking abnormalities in how individual facial features drove neuronal response. Compared to control patients, a population of neurons in the two ASD patients responded significantly more to the mouth, but less to the eyes. Moreover, we found a second class of face-responsive neurons for which responses to faces appeared normal. The findings confirm the amygdala's pivotal role in abnormal face processing by people with ASD at the cellular level and suggest that dysfunction may be traced to a specific subpopulation of neurons with altered selectivity for the features of faces.


Figures

Figure 1
Figure 1
Recording sites. Shown is a coronal MRI scan in MNI space showing the superposition of recording sites from the two patients with ASD (red) and controls (blue); image in radiological convention so that the left side of the brain is on the right side of the image. Recording locations were identified from the post-implantation structural MRI scans with electrodes in situ in each patient and coregistered to the MNI template brain (see Methods). The image projects all recording locations onto the same A-P plane (y = -4) for the purpose of the illustration. Detailed anatomical information for each recording site is provided in Supplementary Figure S1.
Figure 2
Figure 2
Electrophysiological properties of neurons in ASD patients and controls. (A,B) Mean spike waveforms (n = 37 units for ASD; n = 54 units for controls). Waveforms are shown separately for the group of cells that have significant classification images (sig NCI) and those that do not (no sig NCI, see Figure 5). (E,F) The waveforms shown in (A-B) quantified using their trough-to-peak times. (C,D) Relationship between mean firing rate and trough-to-peak time, (G,H), and coefficient of variation (CV2). There was no significant correlation between trough-to-peak time and mean firing rate (P>0.05 in both groups) and CV2 was centered at 1 in both groups.
Figure 3
Figure 3
Task design and behavioral performance. (A), Timeline of stimulus presentation and different types of stimuli used. B, Examples of bubbles stimuli with varying proportions of the face revealed (n is number of bubbles, same as scale in c). (C ), Performance (number of bubbles required to maintain 80% accuracy) over time. Dotted lines are s.e.m. See related Supplementary Figure S2.
Figure 4
Figure 4
Average behavioral classification images (BCIs) for (A) surgical controls (n = 8), (B) ASD patients (n = 2), and (C) an independent group of healthy, non-surgical controls for comparison (n = 6). The colorscale shown is valid for (A-C). (D) 2-way ANOVA of group (ASD/epilepsy control) versus ROI (eye/mouth) showed a significant interaction (P<0.05). Error bars are S.E.M. See related Supplementary Figure S2.
Figure 5
Figure 5
Neuronal classification images (NCIs). (A) Overlay of all significant NCIs (red: ASD; blue: controls, all NCIs thresholded at cluster test P<0.05 corrected; see Supplementary Figure S3 for individual NCIs and their overlap). (B) Example bubble face stimuli with the ROIs used for analysis indicated in red. (C,D) Quantification of individual unthresholded Z-scores for all the significant NCIs shown in (A) calculated within the mouth and eye ROIs. The overlap with the mouth ROI was significantly larger in the ASD group compared to the controls (C, P<0.0008), whereas the overlap with eye ROIs was significantly smaller for the ASD group (D, P<0.0001). All P-values from two-tailed t-tests.
Figure 6
Figure 6
Correlation between neuronal and behavioral classification images. (A,B) Two-dimensional correlation between the BCI from an independent control group (Fig. 4C) and the NCIs of each patient, averaged over all neurons with significant NCIs recorded in the ASD patients (A) and all recorded in the controls (B). See Supplementary Figure S4 for individual correlations. (C,D) Statistical quantification of the same data: Average values inside the mouth and eye ROIs from the 2D correlations. The average Z-value inside the mouth and eye ROI was significantly different between patient groups (P=0.031 and P=0.0074, respectively). All P-values from two-tailed t-tests.
Figure 7
Figure 7
ROI-analyses for all neurons recorded. Shown are Z-values from each neuron’s NCI within the ROIs shown in Fig 5B. Cells recorded in ASD and in the controls are broken down into all (circles) and only those with statistically significant NCIs (diamonds). Errorbars and statistics are based on all cells. In contrast, the data depicted in Fig 5 is based only on cells with a significant NCI. (A) The average Z value inside the mouth ROI was significantly larger in ASD compared to controls (P=0.001). (B) The average Z value inside the eye ROI, on the other hand, was significantly smaller (P=2.6e-6). (C,D) left and right eye (from the perspective of the viewer) considered separately. For both, controls had a larger Z inside the eye compared to ASD, but this effect was only marginally significant for the right eye (P=0.07) compared to the left eye (P=2.4e-7). (E, F) Comparison of ROI analysis and whole-face responsiveness. (E) Comparison of each neuron’s NCI for two groups of cells: those which were identified as WF cells (right) and those which were not identified as WF (left). For both all recorded neurons (blue, red) as well as only those which are either identified as WF or have a significant NCI (light blue, light red) there was a significant difference in their NCI between ASD and controls only for the cells which were not WF cells (P=1.3e-5 and P=4.4e-5, respectively for non-WF cells and P=0.81 and P=0.81 for WF cells, respectively). (F) Comparison of each neuron’s NCI as a function of the WFI of each cell, regardless of whether the cell was a significant WF cell or not. Cells were grouped according to WFI alone. A significant difference was only found for cells with low WFI (P=0.0047) but not for medium or large WFI values (P=0.10 and P=0.79, respectively). All P-values are two tailed t-tests. See related Supplementary Figure S5.
Figure 8
Figure 8
Eye movements to the stimuli. Participants saw the same stimuli and performed the same task as during our neuronal recordings while we carried out eye tracking. Data were quantified using fixation density maps that show the probability of fixating different locations during the entire 500ms period after face onset. Shown are, from left to right, the average fixation density across subjects for ASD-only (n=6), ASD-and Epilepsy (n=2, same subjects as we recorded neurons from), Epilepsy-only (n=3), and control subjects (n=6). The scale bar (colorbar) is common for all plots. See related Supplementary Figure S6.

References

    1. Adolphs R. What does the amygdala contribute to social cognition? Annals of the New York Academy of Sciences. 2010;1191:42–61. - PMC - PubMed
    1. Adolphs R, Gosselin F, Buchanan TW, Tranel D, Schyns P, Damasio AR. A mechanism for impaired fear recognition after amygdala damage. Nature. 2005;433:68–72. - PubMed
    1. Adolphs R, Spezio ML, Parlier M, Piven J. Distinct face-processing strategies in parents of autistic children. Current Biology. 2008;18:1090–1093. - PMC - PubMed
    1. Amaral DG, Schumann CM, Nordahl CW. Neuroanatomy of autism. Trends in Neurosciences. 2008;31:137–145. - PubMed
    1. Anderson JS, Druzgal TJ, Froehlich A, DuBray MB, Lange N, Alexander AL, Abildskov T, Nielsen JA, Cariello AN, Cooperrider JR, et al. Decreased interhemispheric functional connectivity in autism. Cerebral Cortex. 2010 doi: 10.1093/cercor/bhq190. - DOI - PMC - PubMed

Publication types

MeSH terms

LinkOut - more resources