. 2013 Nov 21;155(5):1166-77.
doi: 10.1016/j.cell.2013.10.018.

Probabilistic splicing of Dscam1 establishes identity at the level of single neurons

Affiliations

Probabilistic splicing of Dscam1 establishes identity at the level of single neurons

Satoru K Miura et al. Cell. .

Abstract

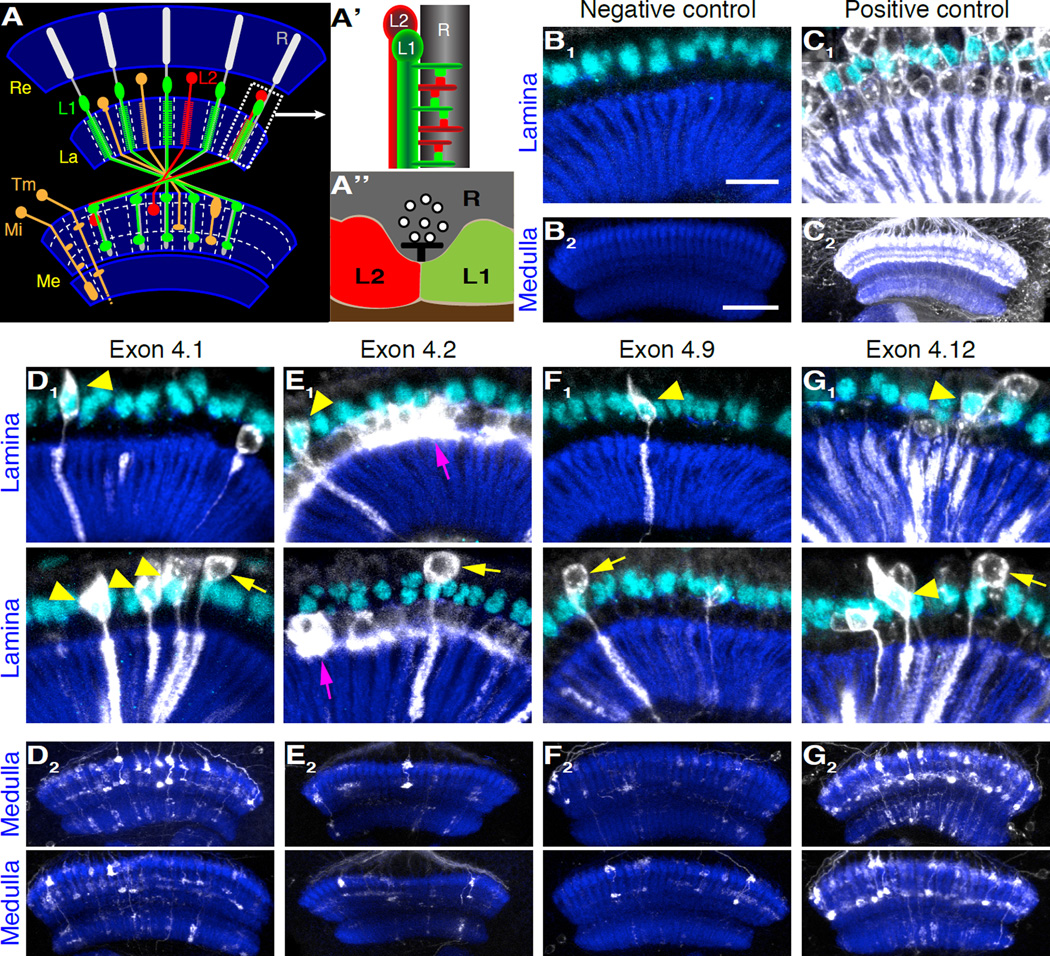
The Drosophila Dscam1 gene encodes a vast number of cell recognition molecules through alternative splicing. These exhibit isoform-specific homophilic binding and regulate self-avoidance, the tendency of neurites from the same cell to repel one another. Genetic experiments indicate that different cells must express different isoforms. How this is achieved is unknown, as expression of alternative exons in vivo has not been shown. Here, we modified the endogenous Dscam1 locus to generate splicing reporters for all variants of exon 4. We demonstrate that splicing does not occur in a cell-type-specific fashion, that cells sharing the same anatomical location in different individuals express different exon 4 variants, and that the splicing pattern in a given neuron can change over time. We conclude that splicing is probabilistic. This is compatible with a widespread role in neural circuit assembly through self-avoidance and is incompatible with models in which specific isoforms of Dscam1 mediate homophilic recognition between processes of different cells.


Figures

Figure 1
Figure 1. The Design of Reporters for Splicing of Alternative Exon 4 Variants
(A) Schematic representation of the Dscam1 genomic locus. Color-coded exons are alternatively spliced in a mutually exclusive manner, such that one variant each from exon 4, exon 6, exon 9, and exon 17 clusters are included in the mature mRNA. Exons 4, 6, and 9 correspond to three variable Ig domains in the extracellular domain that determine the binding specificity of the isoform and encode 12, 48, and 33 variants, respectively. Thus, this gene has the potential to generate up to 19,008 distinct extracellular domains. (B) Splicing reporter design. The exon 4.5 reporter is shown as an example. All variants of exon 4, except exon 4.5, were mutated by a single base pair insertion. A transmembrane domain (TM), “self-cleaving” 2A peptide, and Gal4 followed by a stop codon and polyA site were fused in frame to exon 5. Splicing of exon 4.5 results in the translation of Gal4, which drives the expression of GFP markers under the control of UAS elements. Splicing of any other alternative exon 4 results in a frame shift, generating a stop codon in exon 5. Reporters were generated for all 12 alternative variants. A positive control with all wild-type exon 4 variants and a negative control with all exon 4 variants mutated were also generated. For detailed experimental strategy of knock-in generation, see Extended Experimental Procedures and Figure S1.
Figure 2
Figure 2. Alternative Variants of Exon 4 Are Expressed at Different Frequencies in the MB
Membrane-bound GFP tagged with a V5 epitope (white) was used as the readout of the splicing reporters in the MB lobes (blue) and their intrinsic neurons, Kenyon cells (blue), of mid-pupal brains (65 hr after puparium formation). MB lobes and Kenyon cells were visualized by anti-Fasciclin II and anti-Dachshund, respectively. (A) Schematic of the MB. Kenyon cell bodies form a cluster in the posterior part of the brain. Each Kenyon cell sends an axon through the peduncle (P). Each axon bifurcates and the branches extend into two different lobes. This segregation of the sister branches requires repulsion induced by homophilic binding of the Dscam1 isoforms. Before entering the peduncle, Kenyon cells also form a dendritic field in a structure called the calyx (C). (B and C) The negative control allele resulted in a few weakly stained Kenyon cells (B2), whereas the positive control shows strong expression in the MB lobes (C1) and Kenyon cells (C2). (D-G) The frequency of cells expressing the splicing reporters for exons 4.1, 4.2, 4.9, and 4.12 in the MB and Kenyon cells varied, although the number of cells stained was similar between duplicates of the same reporter. The remaining eight reporters also exhibited these characteristics (see Figure S2). Two independent samples are shown for the MB and the Kenyon cells. Scale bars: 40 µm, B1 – G1; 30 µm, B2 – G2.
Figure 3
Figure 3. Splicing of Exon 4 in Class IV da Neurons Is Probabilistic
(A) Schematic indicating cell body locations of the three class IV da neurons (blue) in a right abdominal hemisegment. Cell bodies of other classes (I – III) of da neurons are also indicated (orange). This organization is repeated in abdominal segments A1 - A7, allowing identification of 42 class IV neurons in each animal. (B) Schematic representation of expression of exon 4 reporter in class IV da neurons in A1-A7. Three class IV neurons (blue ellipse) in each hemisegment correspond to the three neurons in (A). The expression of GFP-tagged histone H2A in the nucleus under the control of UAS element is represented as a white circle. Grey ellipses represent neurons in which staining could not be quantified. This animal corresponds to the first column in (J). (C) A class IV da neuron with nuclear GFP expression in white (above) and no expression (below). Red dashed circle indicates the location of the nucleus. Scale bar, 5 µm. (D–J) Expression patterns of the control and splicing reporters for exons 4.1, 4.2, 4.7, 4.9, and 4.12. Each row represents a cell defined by its unique position: Left and right; dorsal (D), lateral (L), and ventral (V); and abdominal segments A1-A7. Each column represents expression in one animal. Red indicates neurons that do not express the reporter (OFF), blue indicates neurons that express the reporter (ON), and grey indicates neurons that could not be scored. For other splicing reporters, see Figure S3. (K) Boxplots showing different frequencies of expression of the splicing reporters. Y-axis represents percentage of ON neurons per animal. Boxes indicate the first and third quartiles, whiskers denote 1.5 times the interquartile range, and outliers are shown as circles. Numbers in parentheses indicate the numbers of animals analyzed for each alternative exon variant. On average ∼39 neurons could be scored from each animal. The statistical significance of the differences in expression between different alternative variants is given in Figure S3H. *See Extended Experimental Procedures.
Figure 4
Figure 4. Expression of Exon 4 Variants Is Randomly Distributed Among the 42 Class IV da Neurons
Statistical test results for exons 4.1, 4.2, 4.9, and 4.12, indicating no significant difference between the average Pearson correlation coefficients of experimental data (red line) and one thousand trials of randomized patterns (shown as histograms in blue) (p>0.025; two-tailed test). This result was similar for each of the remaining eight variants (see Figure S4). Thus, although the frequency of expression of different exons varies, the spatial expression pattern is not biased towards any cell and is random. For methods, see text and Figure S4A.
Figure 5
Figure 5. Splicing of Exon 4 in Class IV da Neurons is Dynamic
(A–D) Expression of exon 4.6 and 4.10 (and controls) was assessed in the dorsal 14 class IV da neurons of second instar larvae, and the expression in these same cells was determined 48 hours later. Thresholds for expression were determined by fitting a Gamma probability density function to the values from negative control animals (for details, see Extended Experimental Procedures). Neurons whose expression changed between the two time points are indicated with asterisks. Color codes are as in Figure 3. If the expression in neurons could not be quantified at either of the two stages, they were not included in the analysis and are indicated as grey boxes. Cells are indicated by their positions in each row, and each column represents the cells scored in each animal. (E) Example of a neuron switching exon 4.6 expression from OFF to ON. White, GFP-tagged H2A driven by exon 4.6 reporter; red dashed circles, locations of nuclei; and blue, class IV specific marker. Signals were saturated in this panel post-acquisition for viewing purposes. Scale bar, 2µm. (F) Summary table of the number of neurons that switched expression from OFF to ON (left columns) and from ON to OFF (right columns). * p<0.05, Pearson’s chi-squared test.
Figure 6
Figure 6. Scattered Neurons of Specific Cell Types Express Alternative Variants of Exon 4 in the Visual System
(A-A”) Schematic representation of the Drosophila visual system indicating the relationship between the retina (Re), lamina (La), and medulla (Me) (A). The photoreceptors (R), a few classes of lamina monopolar neurons including the L1 and L2 neurons, and two medulla neurons (medulla intrinsic neuron (Mi) and transmedullary neuron (Tm)) are shown. This is only a small subset of the greater than 60 cell types innervating these structures. All neuronal subtypes shown are repeated in the medulla. As such, if specific alternative versions of exon 4 were expressed in each cell of any of these cell types, or others of similar periodicity, highly regular columnar structures and uniform layers would be seen (see Figure S5A). Such patterns were not observed. Importantly, L1 and L2 require Dscam1 for normal patterning of tetrad synapses via self-avoidance (see text). Each tetrad synapse comprises four postsynaptic elements (one L1, one L2, and two other variable cell types (not shown)) abutting a presynaptic site on a photoreceptor (A”). L1/L1 or L2/L2 pairs are prevented through self-avoidance. A pair of L1 and L2 makes multiple tetrads along a photoreceptor axon (A’). (B and C) Expression of the negative and positive controls visualized by V5-tagged membrane bound GFP (white) in the lamina and the medulla. Neuropile structures of the lamina and the medulla were visualized by staining against N-cadherin (dark blue). The negative control does not show any expression in the lamina or the medulla, while the positive control shows strong expression in both. In the lamina, repeated columnar structures can be seen with the positive control, and most, if not all, L1 neurons are labeled. L1 nuclei are identified by specific expression of Seven-up (cyan). Similarly, layers are seen in the medulla, in large part reflecting prominent terminals of lamina monopolar neurons. (D–G) Expression of splicing reporters for exons 4.1, 4.2, 4.9, and 4.12. Two examples for the lamina and medulla are shown. Both L1 (yellow arrowheads) and L2 neurons (yellow arrows), identified by their morphology and the expression of seven-up in L1, were observed with all the splicing reporters tested, but only a subset of each class of neurons expressed a particular alternative variant. Cell-type specific expression of exon 4.2 was observed in the proximal satellite glia (magenta arrow), but few neuronal projections expressing exon 4.2 were found. As no phenotype was observed in flies lacking exon 4.2 (data not shown), the significance of the glial expression is not clear. Color code as in (B) and (C). 5 µm z-stack projections in the lamina, 10 µm projections in the medulla. Scale bars: 15 µm, lamina (B1-G1); 30 µm, medulla (B2-G2). For other alternative variants, see Figure S5.

References

    1. Bateman JR, Lee AM, Wu CT. Site-specific transformation of Drosophila via phiC31 integrase-mediated cassette exchange. Genetics. 2006;173:769–777. - PMC - PubMed
    1. Forbes EM, Hunt JJ, Goodhill GJ. The combinatorics of neurite self-avoidance. Neural computation. 2011;23:2746–2769. - PubMed
    1. Gong WJ, Golic KG. Ends-out, or replacement, gene targeting in Drosophila. Proceedings of the National Academy of Sciences of the United States of America. 2003;100:2556–2561. - PMC - PubMed
    1. Grueber WB, Jan LY, Jan YN. Tiling of the Drosophila epidermis by multidendritic sensory neurons. Development. 2002;129:2867–2878. - PubMed
    1. Grueber WB, Ye B, Moore AW, Jan LY, Jan YN. Dendrites of distinct classes of Drosophila sensory neurons show different capacities for homotypic repulsion. Current biology : CB. 2003;13:618–626. - PubMed

Publication types

LinkOut - more resources